Mike’s Excellent Glucose Monitor Adventure 2


(Michael - When reality fails to meet expectations, the problem is not reality.) #1

It’s been quite awhile …but here I go with part 2 of my CGM adventure! This to celebrate my ketoversary of 5 consecutive years in pretty much continuous ketosis.

Part 1 is here for anyone interested.

Sat, Jan 08

Meals:

21:20 Applied sensor to upper outside right arm. Will activate tomorrow morning prior to my morning keto coffee.

23:00 Went to bed.

Note: Today was a work day. My shift was 0:900 - 17:00.


20 Hour fast
Does a healthy ketogenic diet cause irreversible insulin resistance?
(Michael - When reality fails to meet expectations, the problem is not reality.) #2

Since folks here talk about BG levels in both mg/dL and mmol/L I am reposting this chart from part 1 for reference. My numbers will be mmol/L.

diabetes-chart-1-600x412

The following added to illustrate exactly how Abbott (the makers of the FreeStyle Libre CGM) define glucose levels:


Abbott-2


(Joey) #3

Cool - who doesn’t love data? :nerd_face:

Am curious: any preliminary conclusions reached thus far in your glucose monitoring adventures?


(Michael - When reality fails to meet expectations, the problem is not reality.) #4

Initial reading this am: 2022:01:09::08:14 = 3.2 mmol/L


(Bob M) #5

Just multiply by 18 to get US units. So, 3.2 = 57.6.

When I was testing, I got about twice this as a morning value. Mine were always near or above 100 (5.55).

Two different people can have vastly different blood sugars. And I’ve been LC/keto for 9 years as of 1/1/22, with occasional forays into paleo and The Croissant Diet (tried as a TKD though, for most times).


(Michael - When reality fails to meet expectations, the problem is not reality.) #6

Log 2022:01:09

07:00 Up
07:10 Started Sensor
09:00 Meal 1
11:15 50ml Bitters (20ml Eth = 15.8 gr = 110.6 cal)
11:45 500ml C4mix (20ml Eth = 15.8 gr = 110.6 cal)
12:15 Meal 2
14:00 Nap for 1 hour
17:20 29 gr RWVinegar
17:45 Meal 3
18:30 29 gr RWVinegar
21:30 Bed

Meal Summary
Glucose Plot


Notes:

  • My ‘bitters’ contains quinine extracted from powdered cinchona bark with ethanol. See here. Today I finished off the last of a batch I extracted using 40% Vodka, hence the ethanol calculation. I have started again extracting quinine using 63% Wray and Nephews white rum.
  • My C4mix is a 473ml can of C4 Original and 50ml of either 40% Van Gogh coffee flavoured vodka or 50ml of 49% 99 Banana liqueur. Today’s mix contained VG, hence the ethanol calculation.
  • My RWVinegar is Fiorfiore Red Wine Vinegar.

(Michael - When reality fails to meet expectations, the problem is not reality.) #7

Log 2022:01:10

04:30 Up to heat coffee
05:30 Up
05:45 Meal 1
06:55 25ml Bitter (15.75ml Eth = 12.3 gr = 86.1 cal) WNR
08:30 - 17:00 Walmart work shift
13:10 Meal 2
13:30 - 13:45 500ml Tonic (24.75ml Eth = 19.4 gr = 135.8 cal)
18:30 Meal 3
21:10 29 gr RWVinegar
21:30 Bed

Meal Summary
Glucose Plot


Notes:


(Michael - When reality fails to meet expectations, the problem is not reality.) #8

Log 2022:01:11

04:45 Up to heat coffee
05:45 Up
06:00 Meal 1
07:00 25ml Bitter WNR
09:00 - 17:30 Walmart work shift
13:15 Meal 2
13:45 - 14:00 500ml Tonic
18:30 - 18:45 Lime juice and tonic water
19:00 Meal 3
20:00 29 gr RWVinegar
22:30 Bed

Meal Summary
Glucose Plot


(Michael - When reality fails to meet expectations, the problem is not reality.) #9

Compare 2022:01:10-11 Meal 2

Both these meals were at work and both at nearly the same time of day (quarter past 1). The differences were:

  • Jan 10 - 150 gr Boursin cheese and 46.6 gr Hormel Bacon Crumbles (see here)
  • Jan 11 - 250 gr Great Value cream cheese and 74.5 gr Maple Leaf sliced roast beef (see here)

The Boursin and bacon are both zero carb so the Jan 10 meal was zero carbs. The Great Value cream cheese contains 8.25 gr carbs. The rise in BG began a little sooner and was much steeper during/after that meal. Interestingly, on both days BG was back down to below 6 by 15:00.

Both meals were followed by 500ml of my Tonic. I’m going to try the same two meals again during my next two work shifts (Thu and Fri, since I have today off) but use plain soda water instead of diet tonic.


Does a healthy ketogenic diet cause irreversible insulin resistance?
(Michael - When reality fails to meet expectations, the problem is not reality.) #10

Log 2022:01:12

07:45 Up
09:15Meal 1
10:05 25ml Bitter WNR
12:00 Meal 2
12:30 500ml C4mix (24.75ml Eth = 19.4gr = 135.8 cal)
17:00 Lime Juice and tonic water
17:30 Meal 3
19:45 29 gr RWVinegar
21:30 Bed

Meal Summary
Glucose Plot


Notes:


(Michael) #11

Thanks for sharing your data. May I ask what you weight is in kilograms? You seem to be quite consistent so far in your macronutrient intake, far more consistent than I eat.


(Michael - When reality fails to meet expectations, the problem is not reality.) #12

65.9 Kg (145 lbs)
1.83 M (6’0”)
14-15% BF


(Bob M) #13

8 grams of carbs causes almost a 40 point (US) increase in blood sugar? That seems high.


(Michael - When reality fails to meet expectations, the problem is not reality.) #14

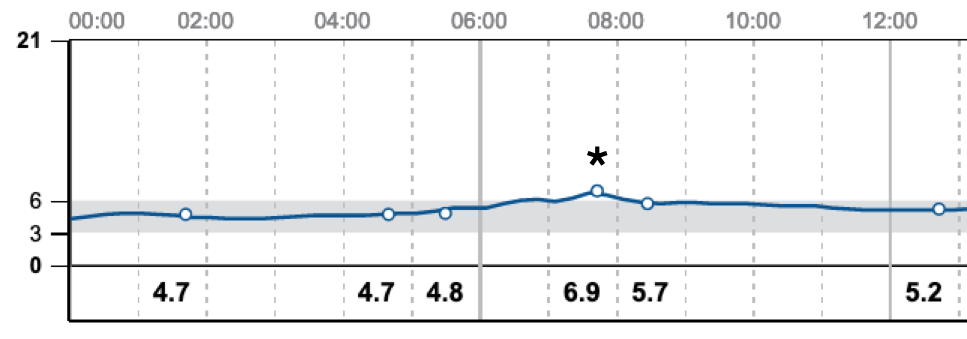
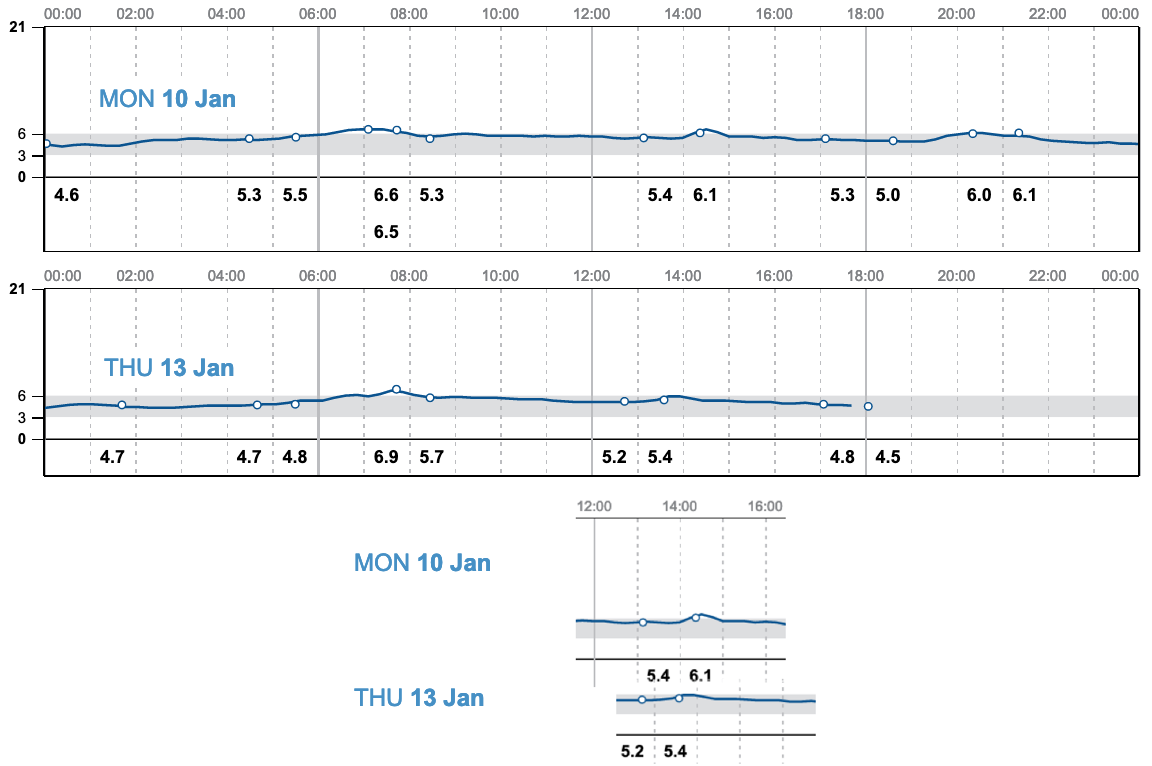
This partial plot from this morning illustrates an interesting experience. My glucose plot was going along pretty normally for the early morning, slowly rising from about 04:30 when I first arose briefly to start my coffee warming. Then continuing from about 05:00 when I got up for the day and prepped my morning keto coffee. Continued to rise gradually as I drank my coffee from 06:00 to 06:30.

You will notice the plot reaches a gentle rounded top at about 6.1 maybe 6.2 around 06:45 and by 07:00 the plot is starting to trend downwards again. Then from about 07:15 to 07:45 the plot spikes to 6.9! Yikes, what happened?

This is not a potty joke, although it might seem so. From about 07:15 to 07:30 I had a very difficult bowel movement. For those 15 minutes or so, I probably did the equivalent of a hundred or more full sit-ups flexing abdominal and intestinal muscles. I probably got my blood pressure up along with the glucose. I was ultimately successful and you can see the plot drop back to about where it would normally have been by 08:30 and continuing it’s downward trend.

Lesson learned: seemingly inconsequential things can have surprising effects!


(Michael - When reality fails to meet expectations, the problem is not reality.) #15

Now a compare.


I want to direct your attention to the glucose plot of Jan 10 from the 5.4 reading just past 13:00 to the 6.1 reading after 14:00. Then look at the glucose plot of Jan 13 from the 5.2 reading at 12:45 to the 5.4 reading at 13:30. I’ve isolated these target areas below the two main plots for direct comparison.

Both these meals consisted of identical foods in identical quantities: 150 gr of Boursin Bouquet of Basil and 46.6 gr of Hormel Bacon Crumbles. Zero carbs. The difference? After eating the solid food I drank 500 ml of my ‘Tonic’. On Jan 10 the tonic included 400 ml of diet tonic soda, on Jan 13 400 ml of club soda instead.

I’m anticipating that tomorrow’s test, which will duplicate the meal of Jan 11 but with club soda again instead of diet tonic, might also show less of a glucose rise. I’m suspecting the diet tonic may have enhanced the effect of the small amount of carbs.


(Michael - When reality fails to meet expectations, the problem is not reality.) #16

Log 2022:01:13

04:45 Up to heat coffee
05:30 Up
06:00 Meal 1
06:45 25ml Bitter WNR
08:30 - 17:00 Walmart
12:30 Meal 2
13:00 500ml Tonic
18:00 - 18:30 Lime Juice and tonic water
19:30 Meal 3
20:30 29 gr RWVinegar
22:15 Bed

Meal Summary
Glucose Plot


Notes:


(Michael - When reality fails to meet expectations, the problem is not reality.) #17

For anyone curious/concerned about absolute glucose ranges, please review my second post above. I’ve added the ranges as defined by Abbott who make the FreeStyle Libre CGM I’m using.

For example, here are my totals for the first 4.25 days (Jan09 - Jan14:06:00):

Note: Left single-click image to view full size.


(Michael - When reality fails to meet expectations, the problem is not reality.) #18

Another compare.


I want to direct your attention to the glucose plot of Jan 11 from the 5.0 reading just past 13:00 to the 7.1 reading after 14:00. Then look at the glucose plot of Jan 14 from the 5.0 reading at 13:45 to the 6.6 reading at 14:30. I’ve isolated these target areas below the two main plots for direct comparison.

Both these meals consisted of identical foods in identical quantities: 250 gr of Great Value Cream Cheese and 74.5 gr of Maple Leaf Sliced Roast Beef. 8.25 grams carbs. The difference? After eating the solid food I drank 500 ml of my ‘Tonic’. On Jan 11 the tonic included 400 ml of diet tonic soda, on Jan 14 400 ml of club soda instead.

So I think this confirms my finding of yesterday that substituting club soda for diet tonic soda reduces the glucose impact. In this second case, the rise was slightly less steep, the peak .5 units lower and the return to normal faster. There was still a significant rise from 5.0 pre meal to 6.6 post meal.


(Michael - When reality fails to meet expectations, the problem is not reality.) #19

Log 2022:01:14

05:00 Up to heat coffee
05:45 Up
06:00 Meal 1
06:45 25ml Bitter WNR
09:00 - 17:30 Walmart
13:40 Meal 2
14:00 500ml Tonic
18:50 Lime Juice and club soda
19:30 Meal 3
19:45 Lime Juice and club soda
21:00 29 gr RWVinegar
21:55 Bed

Meal Summary
Glucose Plot


Notes:


(Michael - When reality fails to meet expectations, the problem is not reality.) #20

Log 2022:01:15

04:45 Up to heat coffee
05:45 Up
06:00 Meal 1
07:00 25ml Bitter WNR
09:00 - 17:30 Walmart
13:10 Meal 2
13:40 Tonic
18:15 Lime Juice and 473ml Rockstar Sugar Free
19:00 Meal 3
19:20 Lime Juice and club soda
21:10 29 gr RWVinegar
22:20 Bed

Meal Summary
Glucose Plot


Notes: