Weight Loss Plateau & Inflammatory hysteresis & HOMA-IR


#1

Just back from getting the latest set of monitoring blood tests. There is good stuff and areas to work on. The HOMA-IR calculation does not look good. Time to re-assess the foods moving forward.

Persistent insulin resistance can be the underlying reason for a prolonged weight loss plateau.

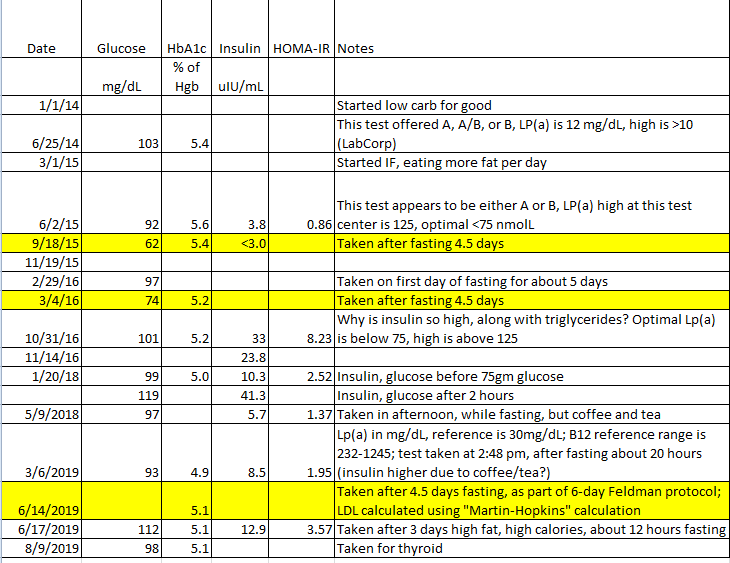
Calculating insulin resistance using the HOMA-IR calculation.

Materials for HOMA-IR:

  • Fasting Insulin blood test result (mU/L)
  • Fasting Blood Glucose taken at the same time (mg/dl)

Use an online calculator: https://www.thebloodcode.com/homa-ir-calculator/

e.g. 12 (insulin) x 94 (blood glucose) = 2.8

Interpretation:
Less than 1 = not insulin resistant/ insulin sensitive
Greater than 1 = possibly insulin resistant
2 = insulin resistant
Greater than 2.9 = significant insulin resistance

Inflammatory hysteresis
hysteresis: the phenomenon in which the value of a physical property lags behind changes in the effect causing it,

The longer [a person] remain on this or any other “high inflammation” diet, the greater the cumulative oxidative stress, and hence also the greater the permanent damage incurred to the organism becomes.

Fig1. The longer you spend on a “high inflammation” diet, the more long-term “damage” you do

Long term on a high inflammatory diet takes time to reverse. It may not be fully reversible. Then it becomes a management proposition that includes not returning to a higher inflammatory diet.

Forum link for people who have been stuck, wondering around, on a plateau: https://lihfliving.com/community/ih/

The editor of the linked forum is particularly interested in the stories of peri-menopausal women who have stubborn, non-shifting body weight concerns.

e.g. plateaus reported in here: The Science Behind Dairy Preventing Weight Loss

A key step to consider trying to achieve weight loss goals is to experiment with removal one of the keto diet’s staple foods: dairy. Lots of discussion in this/our forum (below).

https://www.ketogenicforums.com/search?q=dairy%20weight%20loss%20stall


The Science Behind Dairy Preventing Weight Loss
(Bob M) #2

I had a hard time with this one. I enjoyed the conversation, but I don’t think HOMA-IR is that great of a metric. See these values:

As they admitted on the program, insulin is noisy. If your blood sugar is not, this means your HOMA-IR is noisy, as mine is.

Moreover, if you look at 1/20/18, this was an oral glucose tolerance test (OGTT) with insulin. They were supposed to take values at zero (before glucose drink), 1 hour, and 2 hours, but only took the before and 2 hour versions. The values I got for 2 hours, 119 for glucose and 41.3 for insulin, put me in the “normal” range and my general practitioner at the time (Cate Shanahan) pronounced me “insulin sensitive”. And I took this test without carbing up beforehand, so this is likely a “worst case scenario”.

And this is Dr. Cate Shanahan:

So, I don’t think HOMA-IR is as good of a metric as they make it out to be.

Now, my test on 6/17/19 was after 4.5 days fasting, then 3 days of super high-fat and high calorie, which was a lot of dairy to get the fat content up. Maybe the dairy caused that? The only way to be sure would be to do the exact same test, but eat high fat without dairy fat. I have not done that.

But if you ignore the yellow rows (4.5 days fasting) and the anomalous 112 blood sugar on 6/17/19, I basically have the same fasting blood sugar over the last 5 years, between 92-103. But my insulin is all over. I do not know why my insulin is all over the map.

Also, if you look at other metrics, such as HS-CRP, ferritin, GGT, AST, ALT, you name it, these are all low for me. So, while it’s possible that dairy causes inflammation, in my case, it’s unclear as to how much.


#3

Wow. that’s interesting Bob. Great n=1 stuff. Lots of variation. Different variables? Pretty good numbers, though. You have dived into it. Great research.

Flaws in using fasting insulin resistance models

There are several flaws with using insulin resistance models that are based on fasting insulin and glucose concentrations, including the physiology of insulin secretion and basal levels, the use of insulin resistance as the disease state of concern, and implementation and interpretation of the test itself.

https://www.ncbi.nlm.nih.gov/pmc/articles/PMC5708305/

I standardised my blood tests by going for blood draws at 9am and fasted (14hrs) with a keto meal finished by 7pm the night before, usually built around a piece of red meat, at the same collection place and they go to the same laboratory. No morning coffee nor tea. Just fresh water to be hydrated for an easy blood draw.

Fasting Insulin (mU/L)| Fasting Blood Glucose (mmol/L): 9 | 5.5; 8 | 5.7; 12 | 4.9; 12 | 5.2 (normal <20 | <5.4) These are all 6 months apart. I understand optimal fasted insulin (triangulated from online LCHF functional medicine practitioners) to be less than 10 and aiming toward 5 mU/L. Might not have that correct.

You are right to look at the other inflammatory indicators like hs-CRP and ferritin, plus the liver enzymes. Do you track homocysteine amino acid as well (B vitamins deficiency marker and part of the cardiac risk mix)?

Maybe the HOMA-IR is more significant for some? It appears to be data dependant.


#4

Richard provides the calculations in the post below.