
Not sure how I missed this one…
This is mainly a test of Dave’s Lipid Energy Model (LEM), but there’s a lot of interesting info.
An aside before we start: I’ve always hated statements like “saturated fat raises LDL”, as I think they do not describe what happens with many people, given the situation. For instance, I have fasted 4.5 days, which raises my LDL. I then feasted for 3 days, drinking cups of cream (high in that evil saturated fat). Yet, my LDL went down. I went from zero saturated fat to a ton of saturated fat per day, yet LDL decreased (in accordance with Dave’s LEM, by the way).
Just take a look at this:
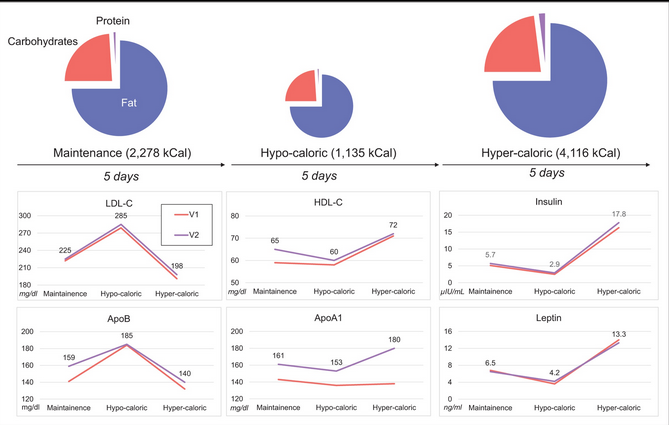
Dave’s LDL increases when he eats low calorie, but decreases when he eats high calorie. Yet in low calorie, his saturated fat was 42g/day, while in high calorie, his saturated fat was over 4 times as much, 174g/day. And his LDL went DOWN, not up.
But look at insulin. Halved eating low calorie, but tripled eating high calorie. (Makes me wonder if some “high” insulin is only “high” because you eat more because you’re heavier, and not “insulin resistance” per se.)
I’ve had two anomalous insulin readings, one of 34, which came not that long after I had fasted 4.5 days. I thought it was some “rebound” effect, but I’m wondering if I was simply eating more?
Other than Leptin, which I’ve not checked, Dave’s pattern is my pattern, too, as fasting causes these same issues (LDL goes up, HDL down, same with ApoB and ApoA1). (And Lp(a) for that matter.)
Anyway, another interesting study by Dave. Congratulations and thank you.
