
As a side question, does anyone know a way to turn off the loud beeper on the AT6000?
Test Breath Ketones without a Ketonix (using a cheap breathalyzer)

CFLBob
(Central Florida Bob )
#428
That’s my next step. I thought there might be some sorta double-secret “hold this button while standing on your left foot 10 seconds but only on the full moon” kind of thing.
roxanne
(Roxanne)
#429
I kinda like the alarm, its positive reinforcement because I’m normally blowing 0.04s
justme
(Linda Culbreth)
#430
The only valid time is Feb. 30, 2030 as far as your sorta double-secret…/
CFLBob
(Central Florida Bob )
#431
Dang! Double leap year day in 2030. I was hoping it might just be on the next lunar eclipse or something.
Well, back to the wire cutters, I guess.
justme
(Linda Culbreth)
#432
Bob, mark your calendar with a double piece of  - you simpley don’t want to miss this date!
ErinClark
(Erin Muterspaugh Clark)
#434
THANK YOU. I was struggling to make sense of all these numbers. Your guide is really the only one I’ve found that makes this easy to understand.
collaroygal
(KCKO, KCFO 🥥)
#435
This thread should help you decide. I have a Greenwon, was less than $10 on Amazon that has served me well.
Frank_C
(Frank C)
#436
is this the keychain one? I just bought that one on Amazon, and so far it reads zero, except when I drink alcohol, but I have not been very strict about my carb intake, although I do IF for 14-18 hrs everyday. I just ordered a dual-blood test (ketone/glucose) meter to make sure of what is going on (it is the keto-mojo, and the ketone strips are very cheap… it is new and I had to pre-order… keeping my fingers crossed that it is not a scam)!!
d_to_the_c
(Damon Chance)
#437
These are super susceptible to how you blow in them. I can easily mess that part up and blow 0’s and then 5 min later try again and get .07 bac… there is definitely an art to it.
- Here’s my procedure on the AT6000 (I Have both it and a Greenwon but prefer the AT6000).
- Start it up and breathe a little deeper as it counts down.
- When it gets to 20 inhale and quickly exhale most of my breath and wait until it beeps to blow out the remainder…
I am usually completely out of breath before it stops the breathing timer. That almost always gets me a reading… sometimes it gets enough so fast it cuts me off and starts calculating.
collaroygal
(KCKO, KCFO 🥥)
#438
Frank_C several have the keychain. The one that has worked well for me doesn’t have the orangy back light, Mine is just a plain black/grey & white back light. I had ordered another under reorder and the orangy one was delivered, it just doesn’t work as well as the older one.
I have been considering getting an AT6000, because several people report they work very well. As I am in maintenance mode now, not weight loss mode, my old Greenwon is still helping me just fine.
betsy.rome
(betsy.rome)
#439
Wow, does this thread have a lot of discussion!!!
I also have the cheap eBay Greenwon with the keychain and orange backlight.
Both my hubby & myself have noticed we never get a reading above 1.9 g/l.
Is that the limit of the meter?
Zimon
(German Ketonian)
#441
Hey everyone,
just a quick update after over a month of data gathering of breath and urine ketone levels. For the breath analysis, I used the AT6000 and the Greenwon device. For the urine levels, I used generic sticks.
I did some statistical analyses with Stata and compared the three explanatory variables AT6000, Greenwon and urine ketone levels against my macros. The results are reinforcing that the breath and the urine test can be used for my N=1 experiment doing keto.
First the means. Note that the AT6000 and the Greenwon variable values are mg/L with a range of 0 to 1.
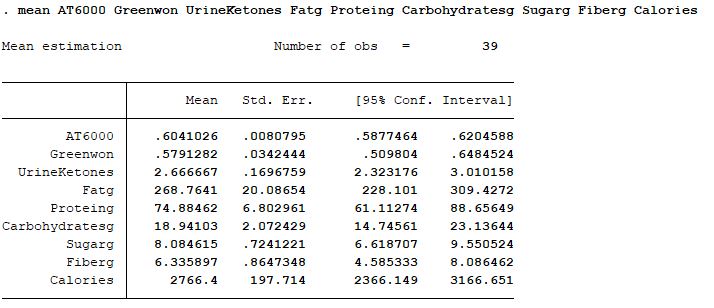
You can see that I have been in ketosis quite deeply throughout the time. Calories have varied within the time frame from September 1st to today quite heavily, from 1800 at times to 5000+, depending on my appetite. Fat, protein, carbs, sugars, and fibers are all measured in grams. Urine ketone values range from:
0: < 0.5 mmol/L = < 5 mg/dL
1: 0.5 mmol/L = 5 mg/dL
2: 1.5 mmol/L = 15 mg/dL
3: 3.9 mmol/L = 40 mg/dL
4: 8 mmol/L = 80 mg/dL
5: 16 mmol/L = 160 mg/dL
You can also see from the macro means that I’ve kept it pretty much according to typical keto proportions: fat around 250, protein around 75, net carbs below 20.
Next, the polychoric correlations. For those unfamiliar, polychoric correlations generally give better results than Pearson, because the calculation is less prone to skewed data, level of measurement or missing data.
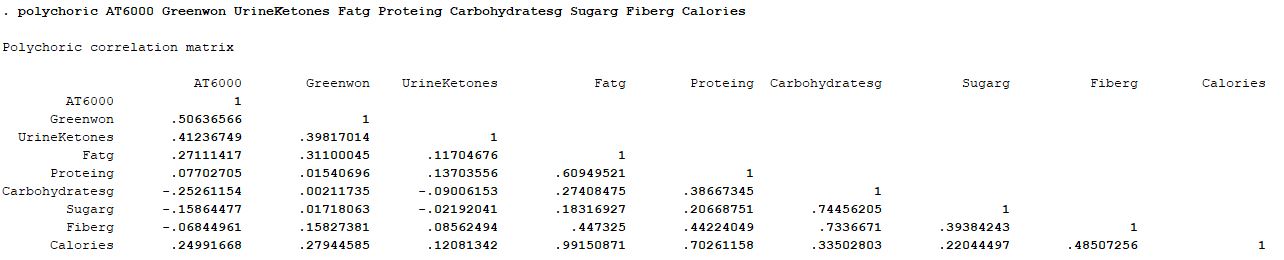
Nothing to shocking here, if you ask me. Everything pretty much seems like expected: Fat is positively and significantly correlated with breath ketones, but (insignificantly) negatively related to urine ketones. Urine ketones are simply too noisy to be used as a reliably indicator, I think. Not that cheap breathalyzers are perfect measurements, but the positive correlations with fat indicates that they might do a good job in my case.
Protein is non-siginificant in breath and urine measurements. It simply doesn’t matter, because I’ve kept it quite low throughout the test time frame. Carbs are interesting: they are quite negatively correlated with the AT6000 device, but don’t peak with the Greenwon or the urines. Sugar is pretty similar to that. Fiber, on the other hand is reversely correlated with the Greenwon device. To me that doesn’t make sense and speaks to my intuition that I got when I compared the devices that the AT6000 is FAR more reliable and my go-to way of measuring my dietary success in terms of acetone excretion. All the AT6000 correlations with the macros in my view perfectly fit the general model about how and why the ketogenic diet works.
To conclude, lets look at a combined regression model for both breath devices.
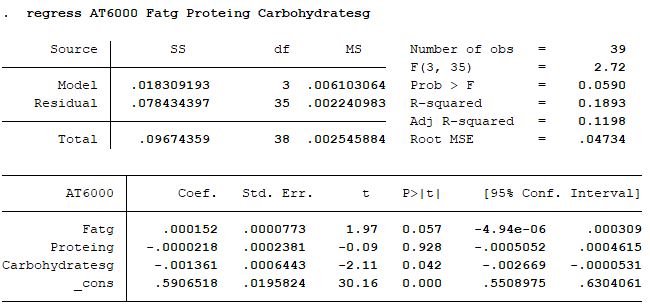
First, the AT6000 device:
And here’s the model for the Greenwon:
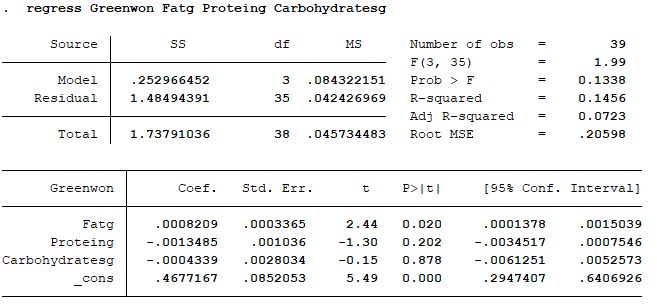
You can see that the three macro nutrients explain roughly 19% of the variance of the AT6000 values and 15% of the Greenwon device. I would say that’s quite impressive given how much other factors like sleep, exercise etc impact your breath acetone levels. This is a hefty chunk of explanatory power for just three factors!
Again, you can see, for the AT6000, fat and carbs are significant in the model, while protein intake doesn’t seem to matter that much (partly because I was very strict at not allowing it to goo beyond 120g, even on my “keto-friendly cheat days”). But it also speaks to my experience, that I tolerate protein excess quite well compared to increased carbs. Carbs in the AT6000 statistical model have a significantly negative impact.
For the Greenwon, only the fat variable is statistically significant. I think this corroborates the impression of the Greenwon device not being as accurate and more strongly fluctuating.
Anyway, I hope you find this interesting. As a PhD student in the social sciences, I love data-mining like that.
d_to_the_c
(Damon Chance)
#442
Holy statistics Z-man!
That’s impressive and the raw data is over my head for the most part but your synopsis cleared it all up.
Zimon
(German Ketonian)
#443
Thanks! I realize some more clarifications might be helpful.
The way you read the first graph is pretty simple. It displays the average values for AT6000, Greenwon, urine ketones, fat, protein, carbs, sugar and fiber. This is what the “mean” column is. The rest is fairly unimportant for those not caring about the statistical details (standard error, confidence interval values).
The second table are the polychoric correlations. Correlations indicate how one variable (let’s call it variable 1 in this example) is related to another variable (let’s call it variable 2 in this example). If the value is positive, variable 1 on average increases whenever variable 2 increases. If variable 2 decreases, so does variable 1 when there is a positive correlation value. On the other hand, if variable 1 is negatively (or inversely related) to variable 2, then increases in variable 2 values are associated with decreases of variable 1 (and vice versa). A perfect positive correlation would be 1 in the table, a perfectly negative correlation would be -1, no correlation would be 0. A correlation of 0 most likely at that point could also indicate too few data points (I only got 39 observations up to this point).
So if you look at the first column AT6000, you can figure out that it has around a 0.5 correlation with the Greenwon device. That’s generally a good sign for cross-checking the data of both devices but also speaks to the fact that there still is some noise and the values of both devices are not identically increasing and decreasing (meaning a correlation of 1). Similarly, you can see that the carbs and sugar values are negatively related to the AT6000 value. Makes sense, doesn’t it? Whenever I had higher consumption of carbs (-.25) and sugar (-.15), the AT6000 decreases. Fat on the other hand is really positively related to it (.27). I didn’t display the significance levels of the values, but the threshold level is roughly a correlation of .10. This means for instance, the negative relation of the AT6000 and fiber is not statistically significant. Anyway, if you’re interested in another variable, just follow the columns or the rows for that variable and stop at the cell where variable 1 and 2 of interest converge.
Ok, let’s head on to the regression models. This is also not as complicated as it may appear. In comparison to the correlation, this is a statistical model where more than two variables can be included. So if we look at the first model for the AT6000, it asks how much of the variance of the AT6000 value can be explained by the combination of the variables fat, protein and carbs.
You can see that there technically are two tables here. The first is generally used to judge the quality of the estimated model, the second includes the dependent variable (variable to be explained, the AT6000 in this case) and the independent variables (variable doing the “explaining”, the three macros in this case). So, the first table may not be that interesting, except for one thing. I’ve talked about that 19% of the variance of the AT6000 can be explained by the combination of the three macros - that’s what the “R-Square” of .1893 means.
In the second table, you can see the dependent variable in the upper row and the independent variables in the row thereafter. For us, only the “Coef.” and the “P>|t|” values are important. Remember when I talked about correlations and statistical significance above? It’s the same thing here! “Coef.” basically means how the independent variable we look at relate to the dependent variable AT6000. Fat is positively related, protein and carbs are negatively associated. But, if we look at the “P>|t|”, we have to accommodate for the fact that not all of those values are significant. In general, statisticians rule that every value below certain thresholds are significant values. This value can be .01, .05, or even .1 if you don’t have many observations. I think in this case, it’s wise to stipulate a cutoff value of .1, because we only have 39 observations and go up, once we arrive at 50+. So we can see that fat and carbs are significant in the model, while protein doesn’t have a clear relationship. Combined with the direction of the relationship of fat (positive) and carbs (negative), that, again, makes sense, doesn’t it?
Statistics isn’t all that complicated, is it? 
d_to_the_c
(Damon Chance)
#444
Awesome explanation. I had inferred the basic interpretation of the polychloric charts but that really cleared it up. Thanks so much for the detailed reply. I’ve taken intro to statistics and business statistics in college but I don’t remember anything about these.