Mike's Excellent Glucose Monitor Adventure


(Michael - When reality fails to meet expectations, the problem is not reality.) #41

2020/03/13 Updates.

09:15 - 10:15 Keto coffee
01:30 - 12:30 Main meal
18:30 - 19:30 Secondary meal
Day’s Meal Summary

Glucose Plot for day 11

Note: This was an interesting overnight experience related to IF. See here for a discussion.

PS: I got in 3 meals today, but still ended up 600 calories short of my daily target. I had planned to drink a creamy bone broth nightcap when I got home, but couldn’t get out of Walmart soon enough to do so. Crazy busy today. Managed to hit my fat/protein macros bang on and carbs just a smidgen more than 5 grams. I finished my last meal at work at 18:30 so I’ll get in another 14 - 15 hour fast by the time I have my morning keto coffee.


(Ian) #42

Fascinating. I also just purchased the same meter from Shoppers in Lynn Valley.

I will be reading your thread in far greater detail and with keen interest when I have more time, i.e. at work, LOL. It will be interesting to compare our results, since I was pre-diabetic, believe I am still strongly insulin resistant and my carb consumption is less controlled than yours. Certainly my morning glucose bumps up higher than yours in the morning.

PS with a BG of less than 3.5 most Doc’s would have a heart attack and immediately send you to hospital. The power of ketones!


(Michael - When reality fails to meet expectations, the problem is not reality.) #43

2020/03/14 Updates.

09:15 - 10:15 Keto coffee
11:30 - 12:30 Main meal
18:30 - 19:30 Secondary meal
23:45 - 24:00 Nightcap
Day’s Meal Summary

Glucose Plot for day 12


How much to eat - newbie
(Michael - When reality fails to meet expectations, the problem is not reality.) #44

2020/03/15 Updates.

10:00 - 11:00 Keto coffee
13:00 - 13:45 Secondary meal
18:00 - 18:30 Main meal
21:45 - 22:00 Nightcap
Day’s Meal Summary

Glucose Plot for day 13


(Central Florida Bob ) #45

@amwassil - since you’re at the end of the 14 day life of the sensor, do you feel like getting another to try more things or do you think you’re done? Did you learn what you wanted to learn?

(Disclaimer - I think I recall someone saying it’s a 14 day life) :grin:


(Michael - When reality fails to meet expectations, the problem is not reality.) #46

@CFLBob The sensor indeed has a 14-day lifespan and it costs me $100 at my local London Drugs. I intend to purchase again, but not immediately. I want to investigate whether I can purchase at a cheaper price elsewhere.

I have a few other things in mind to try. For one, I would like to try to correlate the glucose with my Lumen, to see if that is any more useful than my attempt to correlate BrAce with the Lumen.


(Michael - When reality fails to meet expectations, the problem is not reality.) #47

2020/03/16 Updates.

09:30 - 10:30 Keto coffee
12:00 - 13:00 Main meal
18:00 - 19:00 Secondary meal
Day’s Meal Summary

Glucose Plot for day 14


How much to eat - newbie
(Michael - When reality fails to meet expectations, the problem is not reality.) #48

2020/03/17 Updates.

Final Glucose Plot

Daily Average (Mar 11-17)
Daily Pattern (Mar 11-17)
Daily Snapshot (Mar 11-17)

Complete Report to 2020/03/17 (PDF 583.23K)
Complete Report to 2020/03/10 (PDF 599.33K)


(Michael - When reality fails to meet expectations, the problem is not reality.) #49

Interesting device, really. I tried (not too hard) to open it but failed. The two halves are apparently solidly glued together, which I expected given that it’s designed to survive underwater. Although the three indentations around the perimeter suggest it may be ‘screwed and glued’…


(Central Florida Bob ) #50

Is that one of the CGM sensors? The big white thing looks a little like a power outlet. Hard to tell scale.


(Michael - When reality fails to meet expectations, the problem is not reality.) #51

This gets satisfyingly technical about 4 minutes in.


(Gregory - You can teach an old dog new tricks.) #52

If you will forgive me for not looking back at all your data, how soon after a meal does the effect show up on the monitor?


(Michael - When reality fails to meet expectations, the problem is not reality.) #53

@OldDog Each daily update includes a link to the glucose plot for the full day starting at 00:00. It also includes a list of the times for each meal. You can thus open the glucose plot and look at the meal times. The rise and fall aren’t much. I suspect that caffeine causes the most rise very soon after ingestion. I notice this for all my morning coffee times and those midday or evening meals at work where I’ve had a Red Bull or a Coke Zero rather than a Bubly. Interestingly, Coke Zero seems to cause a bigger rise than Red Bull. Both contain aspartame and Red Bull contains more caffeine. So there’s something else in coke. Nothing dramatic, though.


(Ian) #54

Hey Michael,

Which plot shows your response to Coke Zero? I have not done any specific tests, but I cannot see much response on my CGM to this drink.

Any ideas as to why the sensor only lasts 2 weeks. In-built obsolescence or batter life do you think?

I had a surprising result recently. I was informed, unreliably as it turns out, that Smart Sweets were keto friendly because of their low sugar content, i.e. 3 g of sugar in a 50 g portion with no sugar alcohols. The total carbs were high at 33 g however a large proportion was fiber at 28 g which suggested the net carbs would be relatively low. However, as you can see from my CGM below the Smart sweets sure did spike my blood glucose pretty damn good, way more than the 45 g of carbs I consumed in a Timmies sausage wrap for breakfast. I guess the soluble fiber was also readily digestible.

Just goes to show, if you don’t test, you don’t know.


(Ian) #55

I find that my readings change approximately 30 minutes after a meal


(Michael - When reality fails to meet expectations, the problem is not reality.) #56

No idea. In upcoming tests I plan to track inputs more precisely so I’d be able to answer this question. What I found most interesting was that my glucose plots contained very little up/down deviations while remaining in the mid-low ‘normal’ range. All changes were gradual and not much. From which I conclude that my keto diet overall is helping maintain metabolic homeostasis.

In upcoming tests, I will examine effects of: ethanol, aspartame (diet sodas, Red Bull, etc) and going above 20 grams of carbs daily and per meal.

As for why the sensor only last two weeks, my guess would be the battery. The sensor is a pretty small device overall and there’s only so much space for a battery that’s basically on 24/7. It seems rather expensive for what it does, too.


(Ellenor Bjornsdottir) #57

From what I’ve heard, desirable for people who are not mellite diabetics is 3.5-5.0 fasting, 3.5-7.5 (but not much lower than fasting) postprandially. But that’s based on no source whatsoever.

$100 is the lowest price you can get it for anywhere.


(Bob M) #58

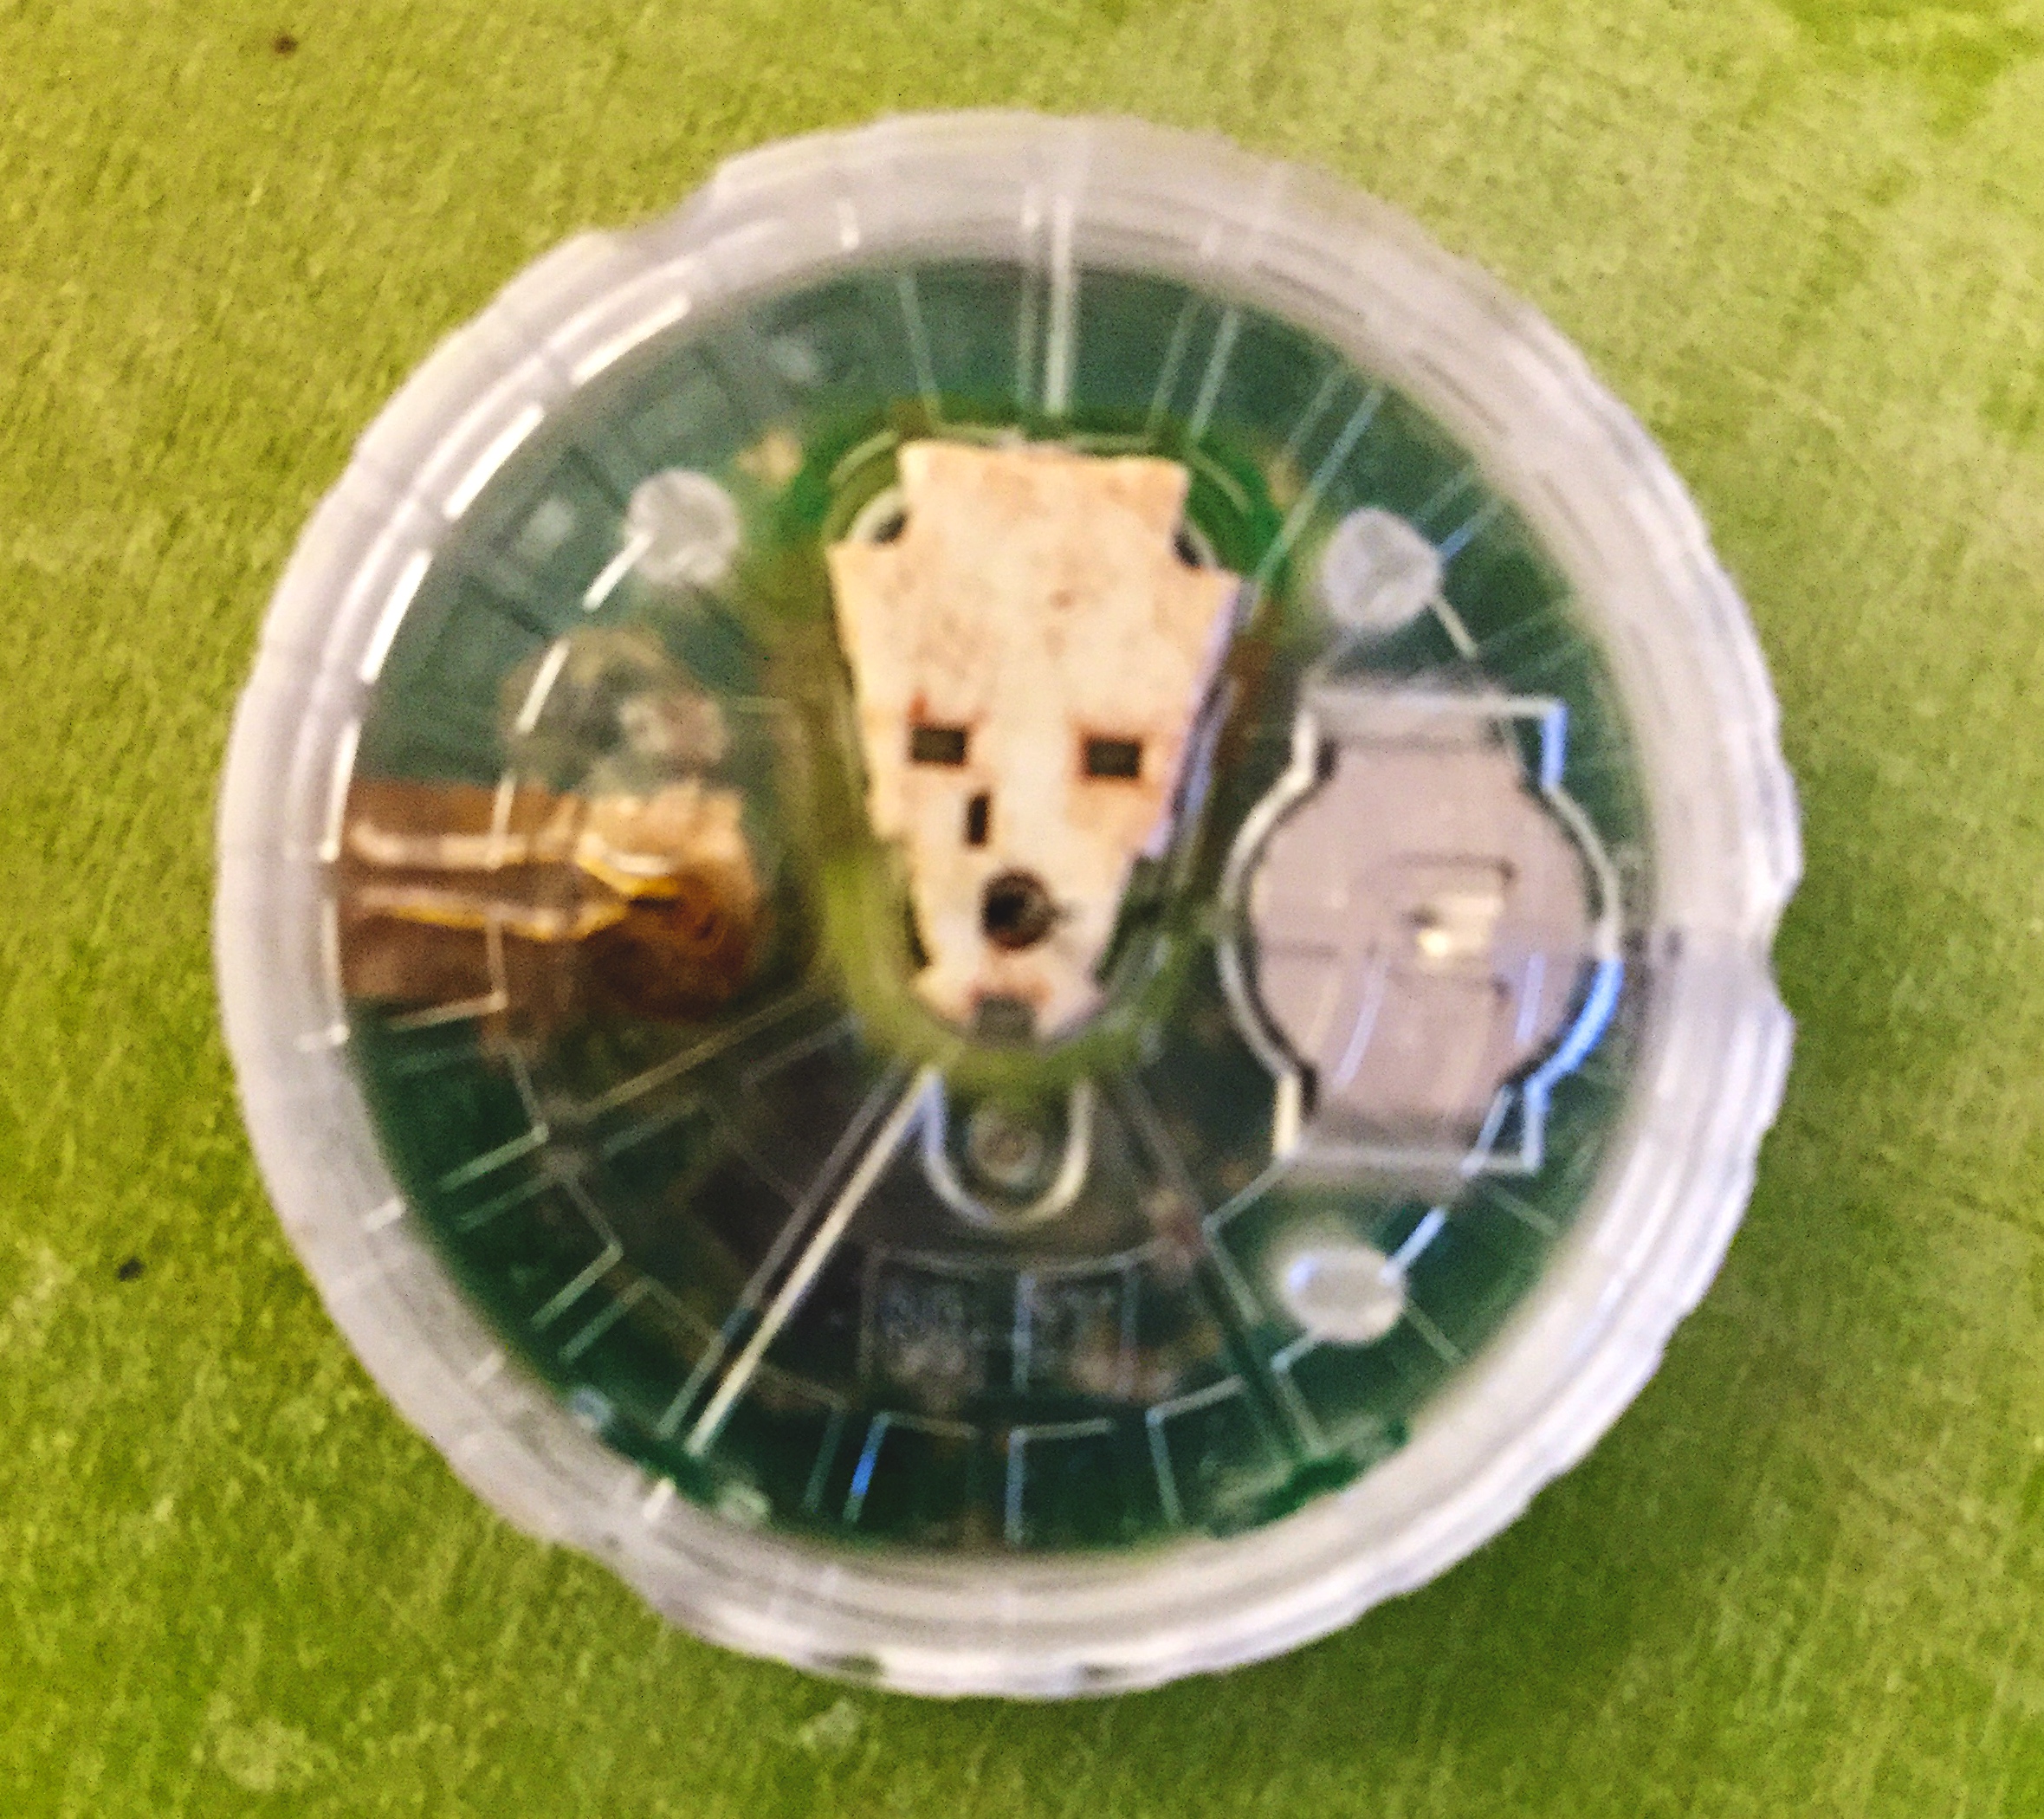
I had a version from Sweden, where this did not happen. I got a version from the US, and this did happen. They were both 14 day.

What I found using mine for a year (bought a year’s supply from Sweden, only $60/month US at the time) was that eating all meat, no matter how high the protein content, caused zero blood sugar rise. I could not get my blood sugar to go up. For instance, this was 1 pound ground beef plus one can anchovies (first dot just before eating a meal):

image

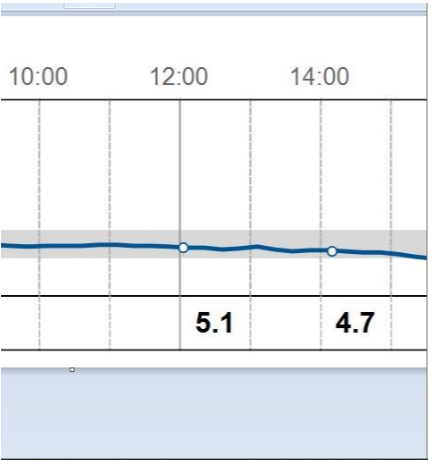
I’ve tested upwards of 160 grams of protein in a single meal, with basically zero blood sugar rise.

For my software, it helped to take readings immediately before then immediately after eating, as the software puts a dot on the output.

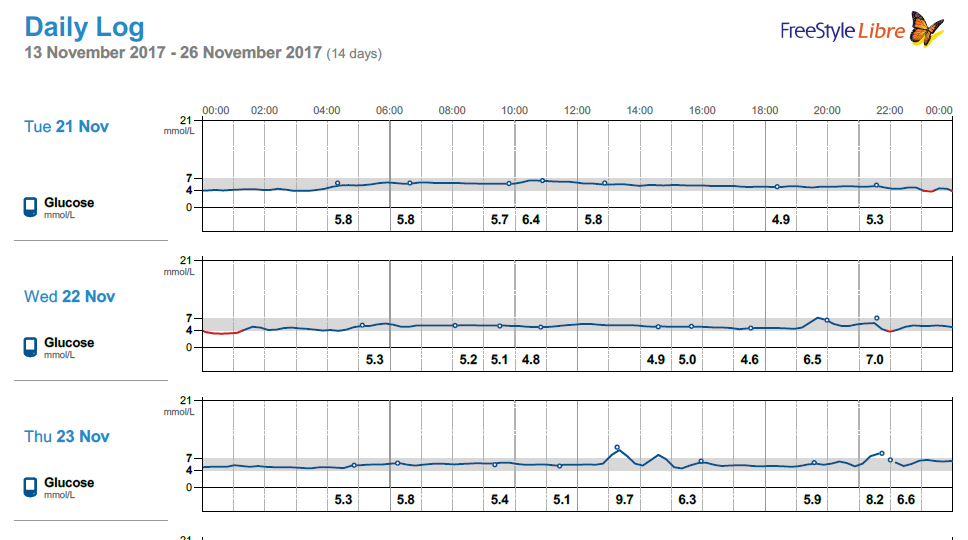
When I ate carbs, my highs to lows were within an hour. This is two days (Tuesday) before Thanksgiving, the day before (Wednesday, that’s a “safe” meal from a restaurant at night, 6.5, which turned out not to be safe, then ice cream, 7.0), then Thanksgiving day (Thursday), with potatoes, homemade sourdough bread, etc., (about 1pm) followed by cheesecake (about 2pm or 1400). See how fast everything goes up and down?

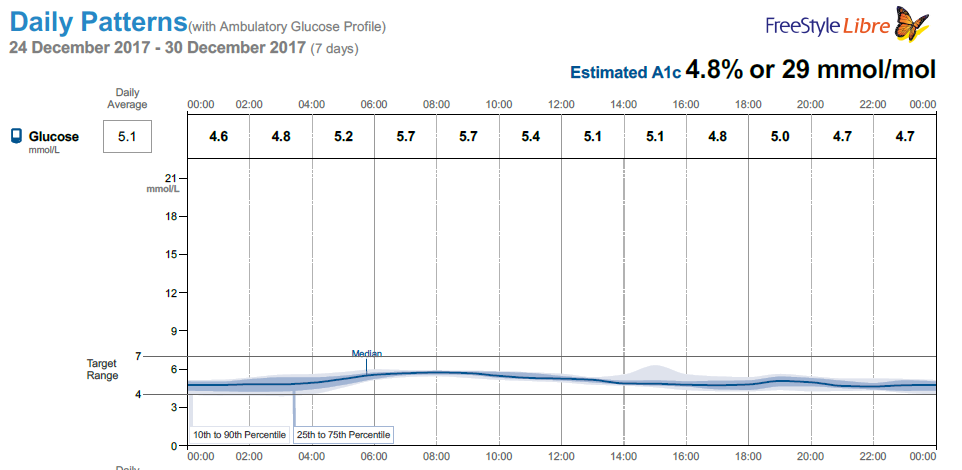
My daily patterns were always like this, low at night, rising until early morning (I don’t eat breakfast, but this also is the time I exercise, which causes blood sugar to go up; usually 3 days/week of exercise), then going down all day. The spikes due to Christmas dinner. Months of data exactly like this. It did not matter whether I was fasting for 1+ days or multiple days; my blood sugar was high in the mornings, though the longer I fasted, the lower my blood sugar would be overall. That is, the entire curve went down. As soon as I ate, though, my blood sugar would be about 100 (divide by 18 = 5.6) in the mornings. This is after 5 years of low carb at that time (now going on my 7th year).