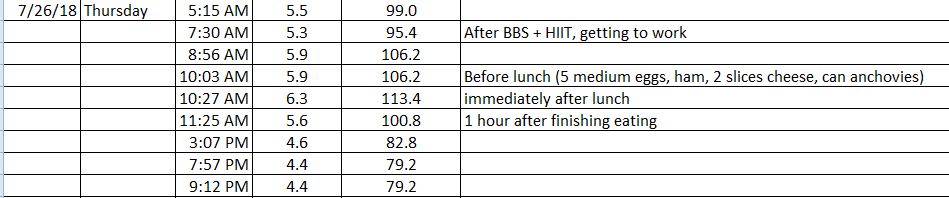
That is true. Here’s one where I ate a pound of ground beef and 1 can of anchovies:
As you can see, this is dead flat. But behind the scenes, I’m getting protein, which will cause some insulin response. However, counteracting that is a glucagon response. That’s why it’s flat. If my glucagon response was not good, my blood sugar would go down. And I’m sure it’s even much more complex than what I said, as the two have to work in concert to achieve this.
If you eat very low carb (basically none in this meal), you don’t have carbs driving sugar, but protein can still cause an insulin response.
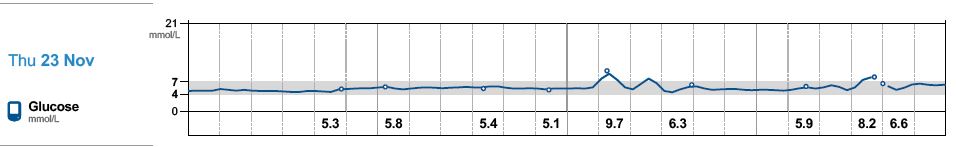
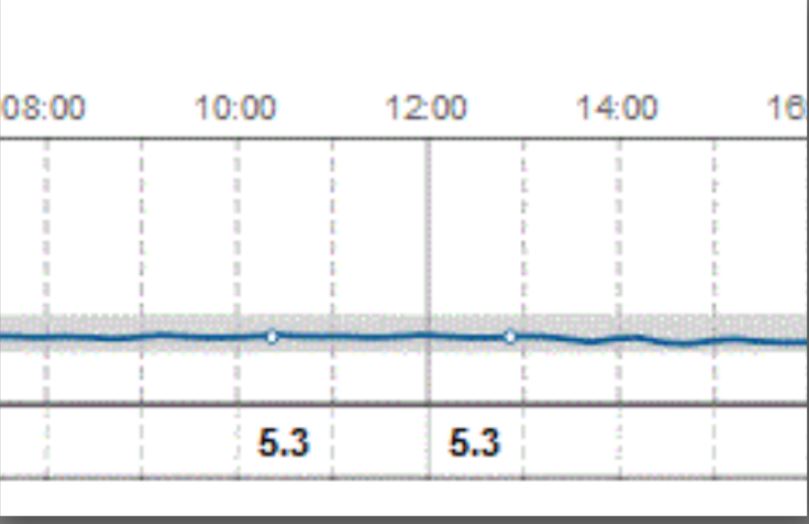
And you can see how well it works:
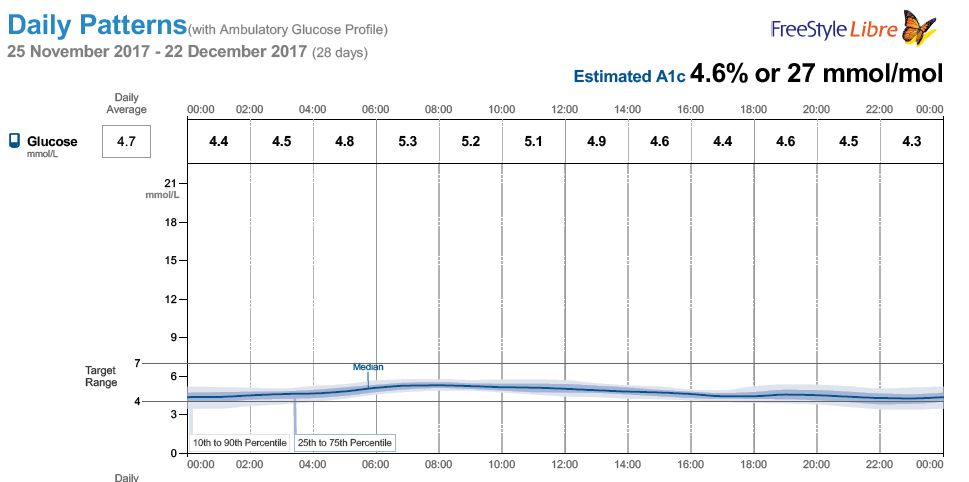
This is a 30 day graph of average blood sugar, and it includes Thanksgiving I show above. These are the 90% indications, though. There’s another graph that shows all the swings, but that one is at home.
The goal is to keep your blood sugar within some range, not too high or too low. If we had insulin meters, we could optimize that too.
This also shows what I was saying about my blood sugar going up all day until about noon or less, then going down all day until midnight or so. I have months of data that look just like this. If I fast, the whole curve moves down; if I eat, it goes up. But the shape is the same.


 ).
).