Why is it so hard for them to figure it out .


(Kent) #1

Just saw this MIT technology review article show up in my email inbox. I am trying to be optimistic that they are at least acknowledging the high carb/high sugar problem but they are still lumping fat in with carbs. And perhaps if you are eating a high carb and high fat diet it is not a good combination. Also, they still are not understanding the part cholesterol plays. So disappointing . . .

I would be interested in other peoples comments on the science or should I saw the lack of good/sound science. I am hoping that a bunch of the really smart people (Nina Teicholz, Ivor Cummins, Zoe Harcombe, @richard, @carl etc.) are lurking and will comment on this article.


#2

Well, just off the top of my head here, if you buy groceries for an entire family how can we tell who’s eating what? If I eat all the butter and my significant other eats all the pasta, where is that accounted for? Jack Sprat…


(Hyperbole- best thing in the universe!) #3

Okay, weird… The map shows almost opposite consumption of sugar and fat by area, with an overlap area in the middle. Sugar consumers seem to be more inner city*, where I assume they have less grocery options. Inner cities in the US are food deserts, meaning no grocery stores or green grocers, just convenience stores and fast food. But as you say, sugar and fat consumption is lumped together in the article. If it really is the low fat low sugar high fiber neighborhoods that are healthiest, I would like to see that explained.

*edit to say I got that backwards. Sorry!

But still, the areas didn’t have much overlap. So the article still fell short in explaining their conclusions.


#4

Just put a big X through the whole cholesterol association.

They go on to show that item weight—which is a proxy for calorie consumption—

Oh my! :scream: A pound of steak and a pound of sugar are the same? Or do they at least separate that out?
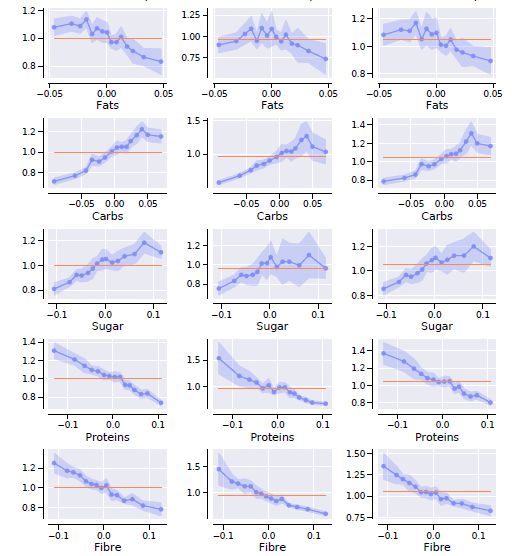
They show, as expected, that increased consumption of carbohydrates, fat, AND sugar is positively correlated with metabolic syndrome (emphasis mine).

Assuming they believe their own data… “AND” is the key word in that sentence.

For further investigation here is the linked STUDY


(Robert C) #5

This makes sense because fat is higher in calories per gram. Eat a lot of fat and you will become fat. It is unlikely that many of the people in the data were on Keto in 2015 so, their fat intake would include Doritos, items deep fried in canola oil, ice cream, etc. - things that are both high fat and make you fat. I think protein is not lumped in because it doesn’t have nearly the addictive qualities of carbohydrates and fat.

What is interesting (to me anyway) is that education seemed to be more important than income in terms of better health outcomes.

The big missing element in the data is the fact that people eat out at restaurants or do “take away” and the kinds of foods in those meals is probably very different from what you make yourself from the supermarket. So, a more affluent area (with more non-supermarket eating) might have worse health outcomes - even if the data showed relatively healthy eating macros.


#6

A chart from the study, in which fat and carbs are viewed separately. Columns are Hypertension, Cholesterol, Diabetes …

As with all these association studies, the statistical analysis is way above my pay grade. Lies, damned lies, and statistics


(Alec) #7

Couple of stats from their study…

“Tesco has 411 shops in London used by 1.6 million customers with loyalty cards, who bought 1.6 billion food items in 2015.”

So each cardholder bought an average of 1000 items in the year, an average of 20 per week? Do you buy just 20 different food items per week? I suppose it’s possible, but that seems very low to me.

More incredible is this:

“The medical prescription data is also available at that neighborhood level. Londoners were prescribed 1.1 billion medicines in 2016, from which the team inferred the conditions they suffered.”

Let’s say there are roughly 10 million people in “London”. With 1.1 billion medicines prescribed, that means the average Londoner was prescribed 100 medicines in that year. 2 per week. Really???