I agree about the CGM. I found out that my blood sugar went up and down within an hour if I ate carbs (except real pizza – which caused the longest peaks by far), which makes me wonder if I was outputting too much insulin. I also learned that things like popcorn, which many think are high carb, caused zero blood sugar rise. Also, a soup from an Asian restaurant, which I thought would be low carb because it had no rice or noodles, caused super high blood sugar. My guess is something like cornstarch.
I’m on vacation and trying to look at this, although it takes a lot of brain power. I thought this was interesting:
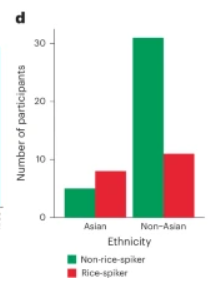
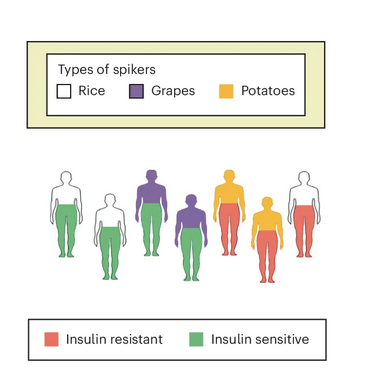
I would’ve guessed that people of Asian descent would mainly be non-rice-spikers (meaning lower blood sugar after eating rice), and people of non-Asian descent would be rice-spikers, but that’s the opposite here.
I’d love to have a CGM for rice/rice noodles, as I will occasionally eat these, because they don’t affect my digestion. At one point, I was trying a TKD (targeted keto diet), where I ate carbs my first meal (of two) per day, on days I did body weight training. I tried a bunch of sweet potatoes, even spaghetti squash, etc., and most of those caused digestive issues. Rice noodles did not. And sometimes I’d go to a Mexican restaurant that had a meal with a lot of meat, but also white rice. Not much rice, but it helped temper the hot peppers they used.
In the year I had a CGM, I don’t think I ate rice at all back then (2017).
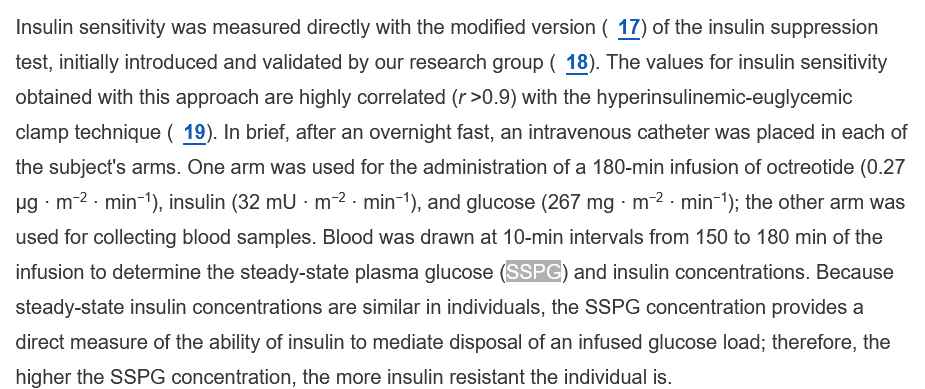
One of the tests they used was SSPG (steady-state plasma glucose):
Which I think is discussed here:
https://diabetesjournals.org/care/article/31/7/1433/39085/Insulin-Resistance-and-HyperinsulinemiaYou-can-t
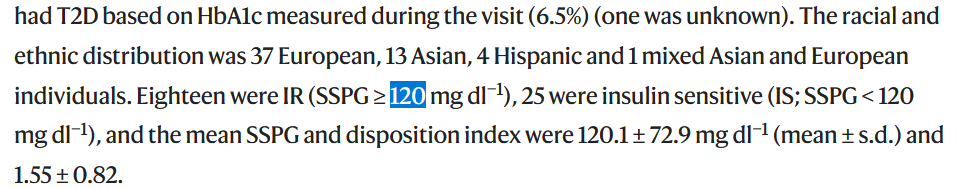
I don’t understand the test (why put both insulin and glucose into the blood? Maybe because they know how much insulin there is?), but I guess the idea is that if you have a higher blood sugar, it’s not going to where it should (muscles, etc.), and therefore you’re insulin resistant, and they use a level of 120 for that.
I haven’t had time to figure out what they do with this, though.