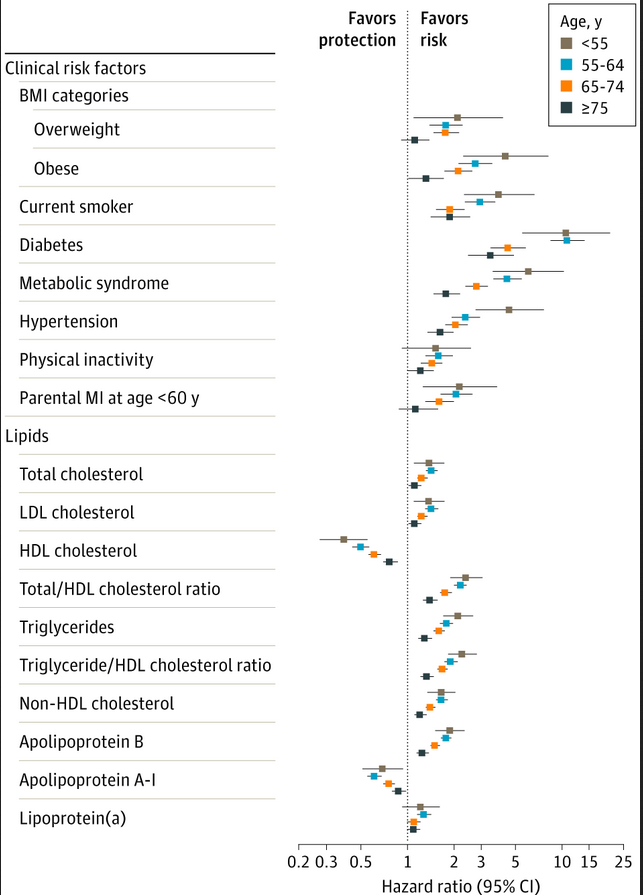
The highest hazard ratio for ApoB is about 2. (Oddly, these are in reverse order of ages: one would expect >75 to have a higher hazard ratio, but < 55 has the highest. My guess: FH, familial hypercholesterolemia, which gets lumped in with high ApoB.) LDL and Lp(a) are below 2. Compare that with diabetes or metabolic syndrome:
Edit: If you’re unfamiliar with “hazard ratios”, the higher the number above 1, the higher the risk. Numbers below 1 indicate lower risk, and possible benefit. That’s HDL and Apo-A1 (which is HDL + similar) are below 1.
Something like diabetes at around 10 is >>>>>>>>>> ApoB in terms of risk. (I’m not sure if diabetes is 10 and ApoB is 2 that the risk is 5 times higher for diabetes; I haven’t looked into that, but it’s going to be a lot higher risk.)
Very interesting graphic. Hazard ratios (like relative risk) is a squishy concept, but nonetheless, putting aside whether these results are cardinal vs merely ordinal, it certainly invites one to wonder what fussing over Lip(a) and ApoB are all about?
It doesn’t mean that there’s NO risk associated with high LDL-C/ApoB, though. Right? I’m not trained in how to read these things, apologies - is it a matter of opinion what “significant association” really is, or is that a black and white level of correlation?
“In comparison, weaker but significant associations with CHD in women younger than 55 years were noted (per SD increment) for low-density lipoprotein cholesterol (aHR, 1.38; 95% CI, 1.10-1.74), non–high-density lipoprotein cholesterol (aHR, 1.67; 95% CI, 1.36-2.04), apolipoprotein B (aHR, 1.89; 95% CI, 1.52-2.35), triglycerides (aHR, 2.14; 95% CI, 1.72-2.67), and inflammatory biomarkers (1.2- to 1.8-fold)—all attenuating with age.”
Fair enough when it comes to the adjective “significant” (although statisticians do have some conventions around such things, they’re still judgments based on the consequences of the adverse outcome).
Most of us find the risk of crashing while driving to the grocery store to be perfectly acceptable. The risk of a plane crash is markedly lower mathematically speaking - but we worry about the latter and shrug off the former. Significance is in the eyes of the risk-taker.
But more importantly, as @Alecmcq notes, association is not causality.
Higher cholesterol may well be the effect, not the cause, of heart disease - which is caused by other things besides the cholesterol, which then increases in reaction. It’s the “fire trucks are associated with house fires” fallacy of logic.
PaulL
(You've tried everything else; why not try bacon?)
#6
Hazard ratio, statistical significance, and clinical significance are three very different things. Hazard ratio is the ratio of the effect observed in the affected population versus the effect observed in the general population. It is also known as “relative risk.” Statistical significance is a measure of how confident we are that the observed effect is real, and not just a random fluke. Clinical significance is a measure of how that effect translates into clinical practice.
So if the rate of a particular disease D in the general population is 1/100,000,000, and the rate of D in the sub-population who show a certain measurement is 2/100,000,000, that is a hazard ratio of 2.0. And that observation might or might not be statistically significant. Let’s say that it is observed to a 6-σ tolerance (probably pretty definitely a real effect). Notice, however, that D is so rare in the general population that doubling the risk has almost no clinical effect. Almost nobody gets D in the first place, so doubling the risk still means that almost nobody will get D anyway.
On the other hand, doubling a risk of 1/10 to 2/10 is much more clinically significant, and the number needed to treat is much lower for seeing a clinical effect.
By the way, there are a number of large, well-funded epidemiological studies that not only fail to show a positive correlation between LDL-C and cardiovascular risk (i.e., more LDL-C => more CVD), but show instead a negative correlation (more LDL-C => less CVD). Now it is a statistical axiom that a positive correlation cannot be used to establish causality (because of the possible presence of confounders in the data); however, it is also a statistical axiom that a negative correlation (e.g., higher LDL-C associates with lower cardiovascular risk) is ipso facto evidence that the association is not causal.
However, the association between saturated fat/cholesterol/LCL-C/Lp(a) or whatever is so deeply entrenched as dogma, that even the large, well-funded studies I mentioned are incapable of dislodging the dogma. In fact, there are studies in which the researchers’ published conclusions are directly contradicted by their very own data (printed in the same study), that’s how entrenched the dogma is.
I would love to see these charted against prothrombin time as wella s thicker blood aspects such as Leiden Factor(FV) . I suspect there will be a very strong correlation between these lipds and FV or FVIII.
After adjustment for smoking, hypertension, obesity, physical activity, education, and alcohol consumption, the HR for a future CHD event in a comparison of the upper tertile of the oxLDL distribution with the lower tertile was 4.25 (95% confidence interval, 2.09 to 8.63; P <0.001). Plasma oxLDL was the strongest predictor of CHD events compared with a conventional lipoprotein profile and other traditional risk factors for CHD.
Again, this is not causation, but is strongly indicative of the role of oxLDL in CVD. I think they will get there eventually - after exhausting all other avenues of course - but don’t expect to see a smoking gun study in a system that doesn’t want to risk the financial health of big food and big farma(intended) - the only sectors of the US economy still growing(pun intended)…
PaulL
(You've tried everything else; why not try bacon?)
#10
Establishing causality is a tricky enterprise. For example, high readings on thermometers correlate exceedingly strongly with having a fever. This is therefore a strong indication of the role that thermometers play in causing fever. So the logical conclusion is that any action taken to lower the reading on the thermometer will help reduce fever. But paradoxically, putting the thermometer in a bowl of ice does nothing to reduce a fever. Go figure!