
Well it’s that time…I finally have been on keto for three months. In some ways it seems like I have been doing LCHF for a lifetime…in other respects, it feels like I just started this yesterday. I went to the doc on Friday to get the results of my blood work. I had blood work done the day before I started keto so I was anxious to see what…if anything improved. A little background. I was diagnosed with metabolic syndrome, Non-Alcoholic Fatty Liver, Insulin resistance, hypertension, not so good cholesterol, and other things that I fail to remember. At the start of this great journey that I am on, I was 328.8 pounds. I am 6’3" tall. I was wearing 46 inch waist pants, my measurement around the thickest part of my belly (over the belly button) was 55 inches. My neck was 20 inches.
Currently I am 279.8 pounds, and have a 47.5 inch waist (across my belly) and am wearing a 40 inch waist in my pants. My neck is right at 18 inches.
Here is a quick synopsis of my blood work. I started Keto on January 2nd, 2018 and had my blood work last done on April 2nd. I am also including past blood work since July of 2017 for a full picture. I’m not showing everything…but if there is something you all want to know that you think is important…ask and I will likely let you know.
All I can say is that I am super excited. Had it not been for the person who suggested keto to me…I am confident that I would have ended up with Type II Diabetes. I am also including the complete NMR Lipo Profile, but this was the first time I have done this one. My LDL particles sizes don’t paint a pretty picture, but since all my other measurable are good or have significantly improved…I am not as concerned and we will see what happens in the next three months.
Your comments are most welcome. Thank you all for providing some very valuable information!
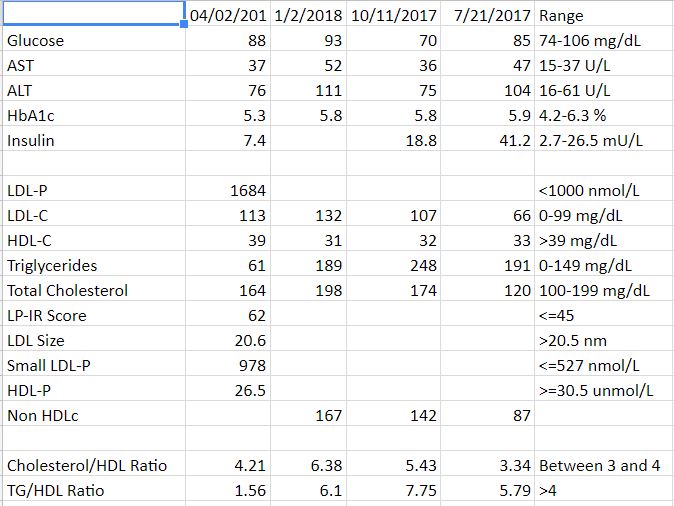
NMR LipoProfile (McK)
NAME VALUE REFERENCE RANGE
F LDL - P 1684 H <1000 (nmol/L)
- Low < 1000
- Moderate 1000 - 1299
- Borderline-High 1300 - 1599
- High 1600 - 2000
- Very High > 2000
F LDL-C 113 H 0-99 (mg/dL) - Optimal < 100
- Above optimal 100 - 129
- Borderline 130 - 159
- High 160 - 189
- Very high > 189
- LDL-C is inaccurate if patient is non-fasting.
F HDL-C 39 L >39 (mg/dL)
F Triglycerides 61 0-149 (mg/dL)
F Cholesterol, Total 164 100-199 (mg/dL)
F HDL-P(Total) 26.5 L >=30.5 (umol/L)
F Small LDL-P 978 H <=527 (nmol/L)
F LDL Size 20.6 >20.5 (nm)
- ** INTERPRETATIVE INFORMATION**
- PARTICLE CONCENTRATION AND SIZE
- <–Lower CVD Risk Higher CVD Risk–>
- LDL AND HDL PARTICLES Percentile in Reference Population
- HDL-P (total) High 75th 50th 25th Low
-
34.9 34.9 30.5 26.7 <26.7
- Small LDL-P Low 25th 50th 75th High
- <117 117 527 839 >839
- LDL Size <-Large (Pattern A)-> <-Small (Pattern B)->
- 23.0 20.6 20.5 19.0
- Small LDL-P and LDL Size are associated with CVD risk, but not after
- LDL-P is taken into account.
- These assays were developed and their performance characteristics
- determined by LipoScience. These assays have not been cleared by the
- US Food and Drug Administration. The clinical utility of these
- laboratory values have not been fully established.
F LP - IR Score 62 H <=45 - INSULIN RESISTANCE MARKER
- <–Insulin Sensitive Insulin Resistant–>
- Percentile in Reference Population
- Insulin Resistance Score
- LP-IR Score Low 25th 50th 75th High
- <27 27 45 63 >63
- LP-IR Score is inaccurate if patient is non-fasting.
- The LP-IR score is a laboratory developed index that has been
- associated with insulin resistance and diabetes risk and should be
- used as one component of a physician’s clinical assessment. The
- LP-IR score listed above has not been cleared by the US Food and
- Drug Administration.

 CONGRATS!!

