Thanks, Dr. Ben Bikman, for pointing this out.
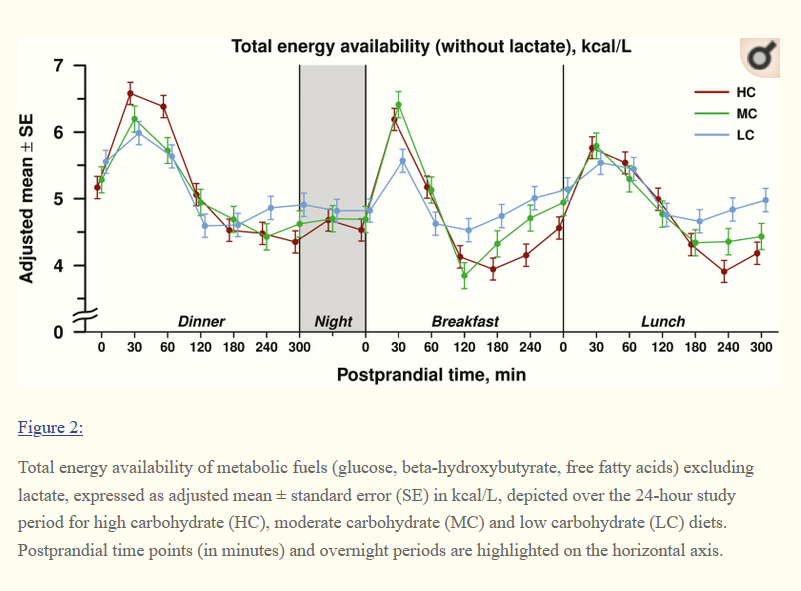
See this, and note the energy for LC (low carb, 20% calories from carbs) is much “flatter” than for HC (high carb, 60% calories from carbs):
Interesting way of looking at things.
Here’s the full study:

Thanks, Dr. Ben Bikman, for pointing this out.
See this, and note the energy for LC (low carb, 20% calories from carbs) is much “flatter” than for HC (high carb, 60% calories from carbs):
Interesting way of looking at things.
Here’s the full study:
Thanks, Bob. If the peaks and valleys correspond to satiety and hunger, it’s a nice corroboration with what most folks report as their energy experience. That is: fast/high burst from elevated carbs followed in 2-3 hours by crash and burn. The lower overall carbs the less pronounced the energy gain/drain. It would be interesting to see a similar chart/comparison with a group in full nutritional ketosis. My bet is their energy graph would be nearly a straight line or a gentle wave form.
I think that’s the idea. And, as you said, it does seem to make logical sense. And it always made physical sense, even from way back when I was on super low fat: I’d eat and then be hungry shortly thereafter.
Yeah, I think keto people would be rock solid on this. I only have CGM data to go by, and some BHB data. My CGM data was pretty flat, though I got a morning rise and then a gradual lowering until night. For BHB, it was opposite, so the total effect was probably pretty flat. If CGMs ever come down in price again, I may have to try a similar experiment.
Can’t measure FFAs though.
And I’m not sure how I’d come up with a number for comparison. There might be a formula in the paper, though I did not read it in enough detail yet.
My daily glucose plots were also quite flat. I have to presume that the energy plots from the study correspond at least roughly if not precisely to BG levels. So for what it’s worth in comparison, here’s a sample of a daily glucose plot from March 4, 2020. I think it would be very difficult to determine my meal times from this plot.
Wait? You took all those readings, even in the middle of the night? Impressive.
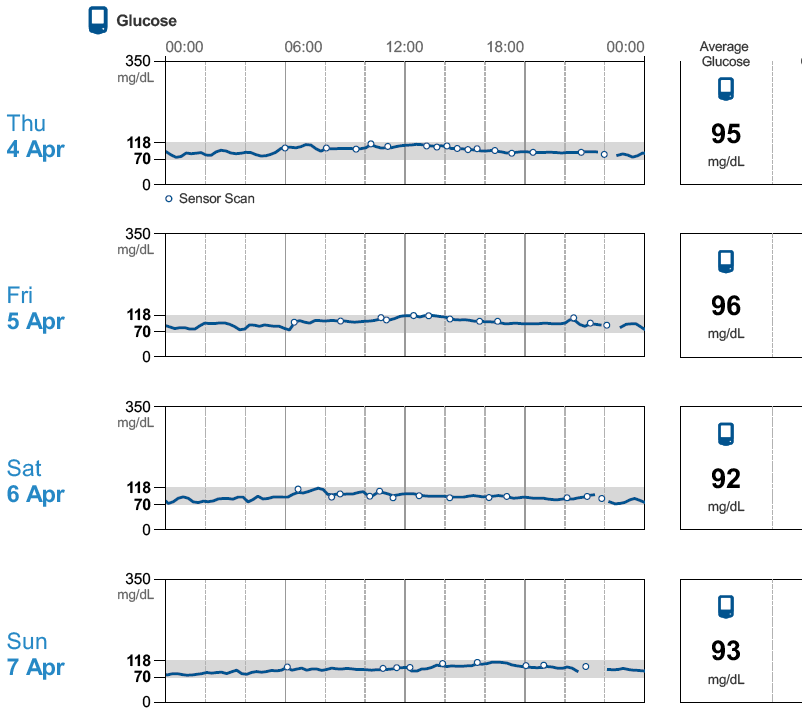
Mine are pretty much identical to those. Here are some days from my US version (divide by 18 to get your units), and my US version tended to read higher than did my Swedish version. The US version also seemed to read higher initially, then go down over time. That is, Day 1 is higher then Day 13.
I assume on Saturday, I excised that morning, which is what caused the hither morning blood sugar. Probably the same case on Thursday.
 I normally awaken several times during the night. While using the CGM I kept the reader on the night stand and whenever I awoke took a reading.
My guess is yours and my glucose plots are probably typical of folks in consistent ketosis. I would further guess that insulin resistance and/or T2D would cause more variability and maybe the variability could be used as a rough guage of severity.
I awaken at night too, but I never thought of taking the readings, though I wish I would have. Most of my lowest readings came at night, and it would be nice to “double check” those.
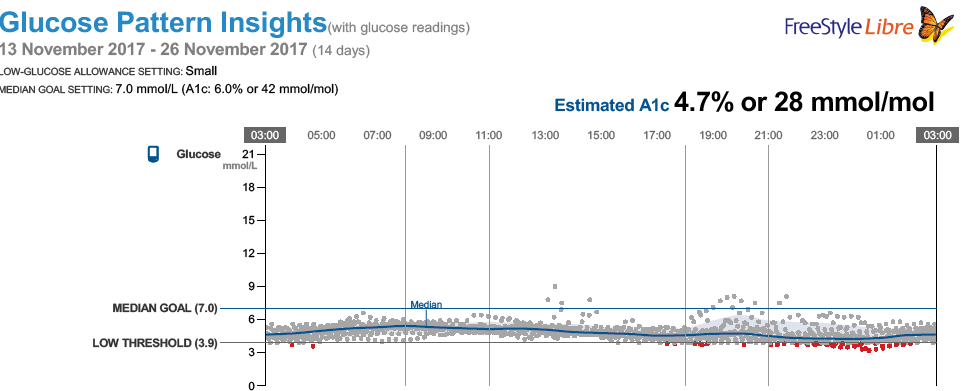
As an example of a time with high carb intake (this from my Swedish CGM), this includes the day before Thanksgiving and Thanksgiving, both of which included high carb. The spikes near 13:00-15:00 are Thanksgiving dinner (bread, stuffing, potatoes, etc.) and dessert (I think cheesecake?). The spikes in the evening are leftovers or the day before Tgiving, which included at least ice cream. Some lows were caused by crashing after carbs:
As for the insulin resistance and/or T2D, that could be true.
I also note that I have a very fast response - within an hour, my blood sugar is up and down, back to its initial level. That’s why the peaks look short - they are short.
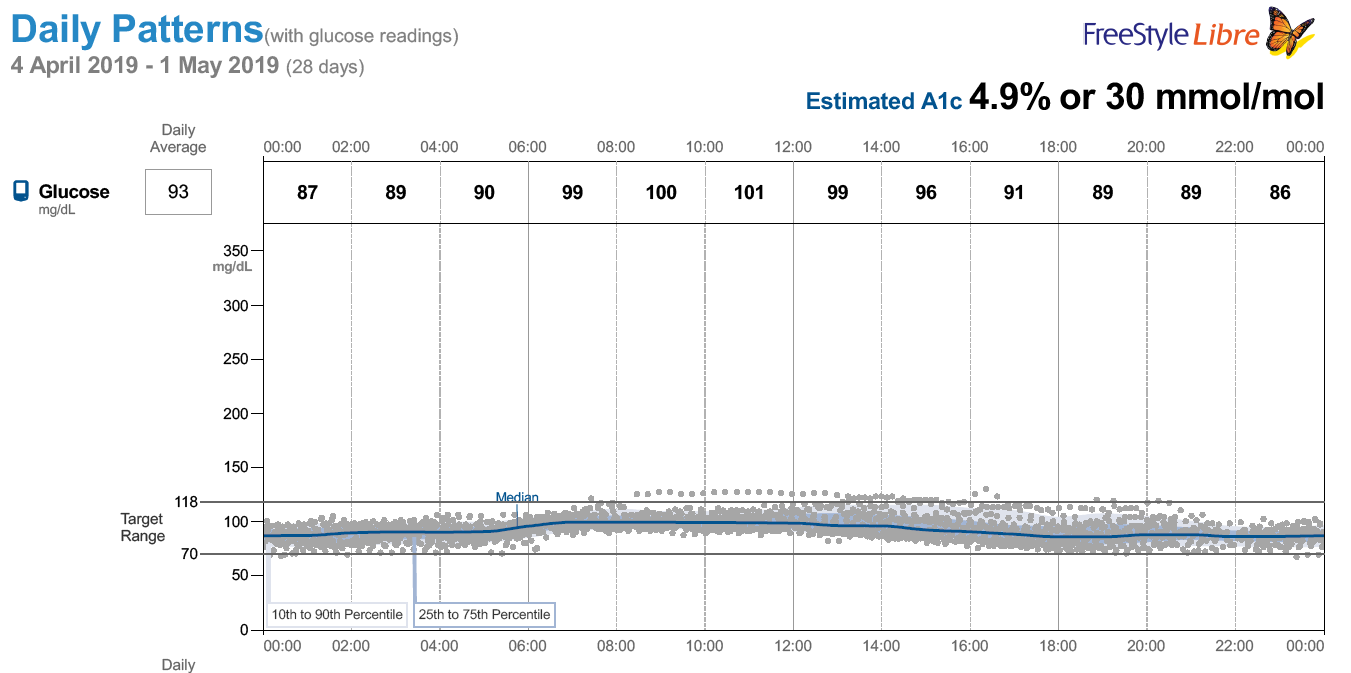
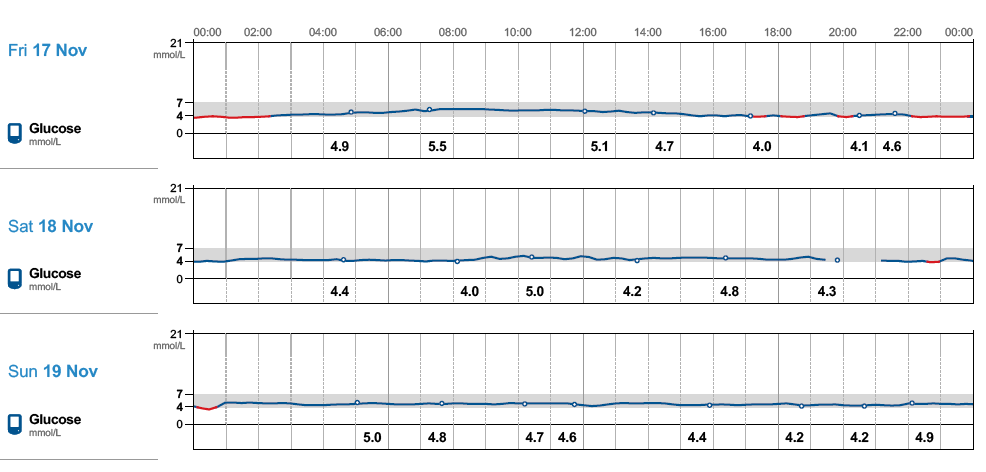
Hmmm…Since I had this PDF up, check out these for flat. I would say I was fasting, but I never fast on Saturday or Sunday (that is, I eat at some point those days). Impressive, I must say.
I would conjecture that response times for carb/glucose excursions are probably fast/short when you’re consistently in ketosis with a relatively healthy metabolism. The incoming glucose rise is dealt with quickly and painlessly and your metabolism moves back to the main fuel source. Again, I would expect folks with a damaged metabolism to respond more slowly and depending on severity of metabolic disorder involve additional complications.
I can get behind that. I just wish I had something to compare, either CGM data like this or, better yet, a short Kraft OGTT + insulin test over the time I’ve been LC/keto. Unfortunately, when I started 6.5 years ago, CGMs weren’t a “thing” and I had never heard of Kraft.
Also, I’ve measured ketones and have been shocked at how quickly I get back into ketosis. I made the mistake of not measuring ketones while knowing I was going to eat high carb, though, such as over the holidays. I just assumed I’d be out of ketosis, but since I’ve been in ketosis for so long, maybe that’s not true?
Assuming we can have a “normal” set of holidays this year, maybe I’ll measure ketones to see what happens.
By the way, what caused the worst peak for me? (In terms of long, high blood sugar.) Pizza. Had pizza a few times, and the response was always long and high, as in way longer than my normal. Not sure why.