I have to say that that data is suspect. Unless you get data from random people, you don’t have good data. Those people giving him data are a very select subset of people who actually take data, for instance.
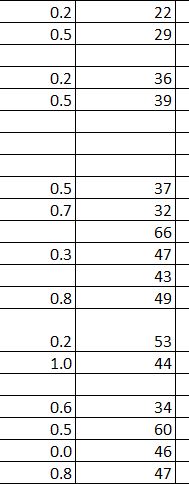
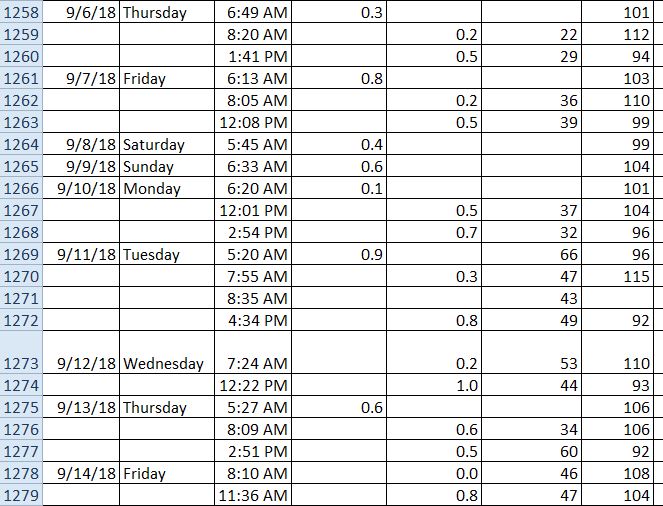
Also, my morning reading today was 0.9 mmol/L BOHB and 96 mg/dL (5.3 mmol/L) or 6.2 on that scale (about 36 hours fasting). After a 50+ minute workout (no food, only coffee), the results were 0.3 mmol/L BOHB and 115 mg/dL (6.4 mmol/L), or 6.7 on that scale. Based on that graph, it appears I’m killing myself. But I have no control over this, and it’s just the way my body is right now. I can’t make my blood sugar go down if I’m fasting. It’s not possible. I only get into low blood sugar in the evenings (even if I eat low carb), as my blood sugar pattern is that my blood sugar nadir occurs around midnight, then rises until about noon or so, then decreases all day long. Food intake adds small bumps to this pattern, but this is my pattern, determined using a continuous glucose monitor. My last HbA1c was 5.0, and this is about as low as it’s going to go.
So, that graph is fearmongering.