
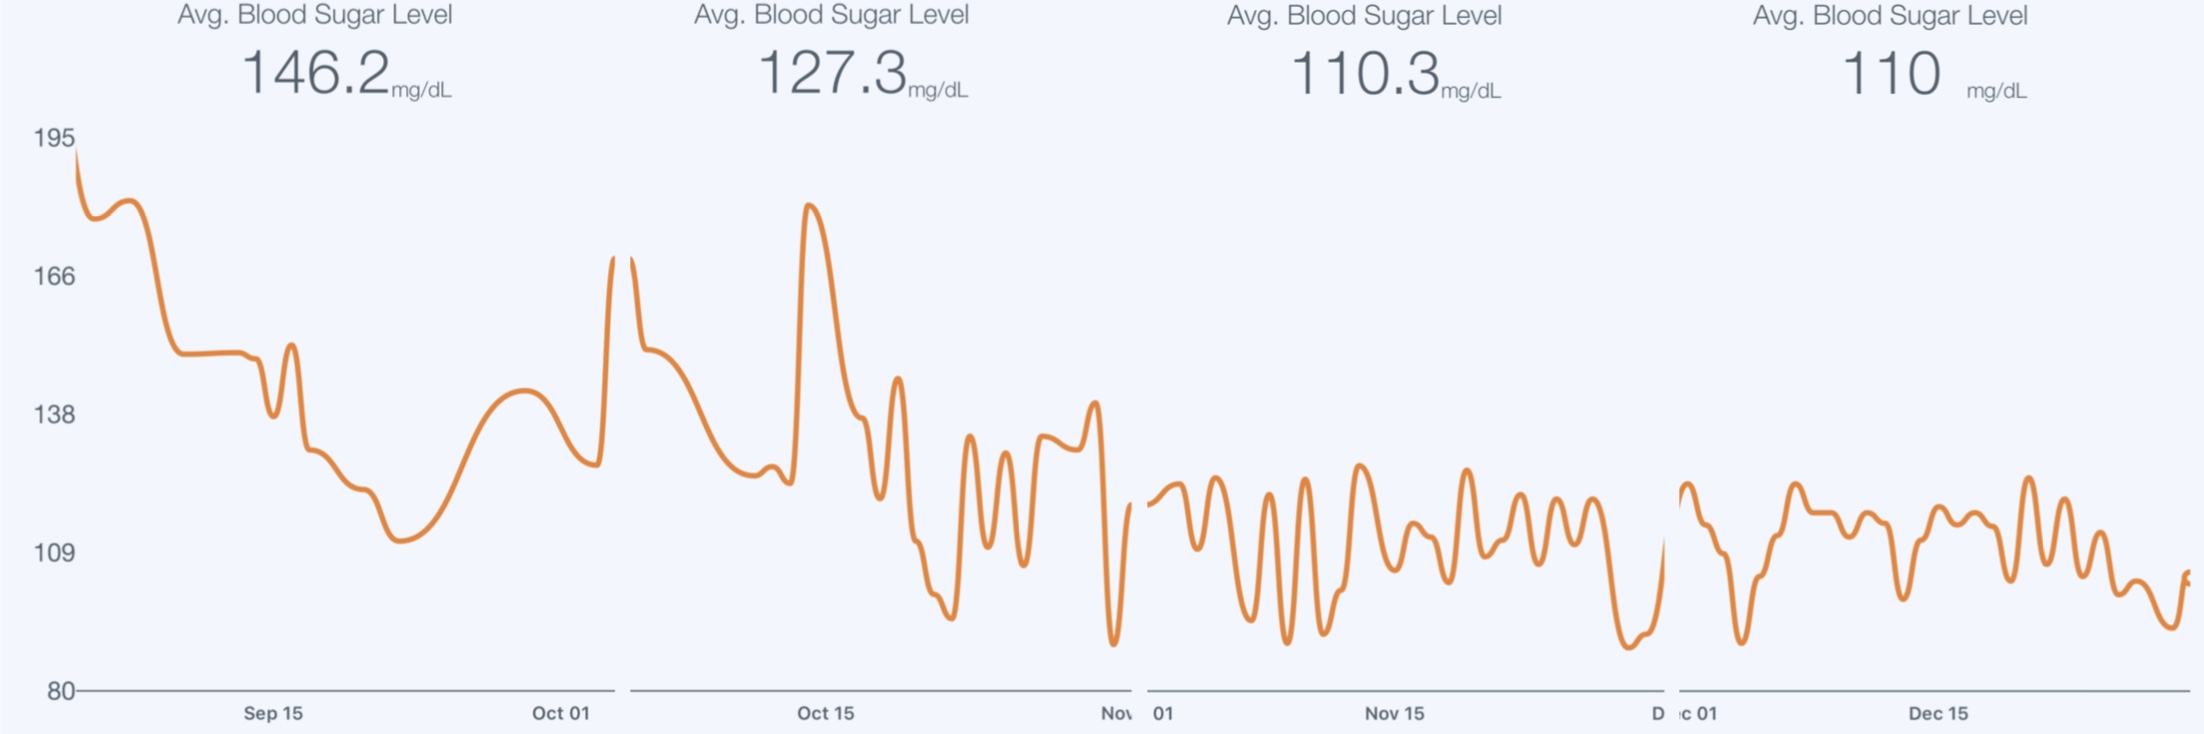
I can’t find an app that lets me take the data and display it the way I want. This one came near close enough. But as you can tell I had to get creative. I would love to see ALL the data, in one continuous graph. I couldn’t include any more than I did in this because including anything prior to this would shift the scale so that they would no longer be comparable to each other. Not to mention not being able to link them like this.
If anyone knows what I can use to graph out everything, please reply. I can never really have too much data.
And for the curios, the table before that would cap out at 600 or so. Was like an avalanche going low carb.