New Lingo data sensor


(Central Florida Bob ) #21

My perspective on this recently changed a lot. I went to my grocery store (Publix) that has prescription drug store in it. If you did the old, regular, one morning test with a blood sugar meter for four weeks, you’d need to buy 28 strips. Closest is a 35 pack. At this OTC drug store, they wanted $73 for a pack. The girl at the counter said they’d sell it for less if I had insurance. $90 for continuous measurements for 28 days sure beats 28 once a day measurements for $73.

Instead, I bought the same bottle of 35 from Amazon for $17. (Edit - I put 73 for the “bottle of”)


(Bob M) #22

Yeah, the stores are more expensive. While Amazon is cheaper, and my wife and I buy TONS of stuff from Amazon, if Jeff Bezos could have zero people working at his company, he would. He’s like most billionaires - they only care about themselves.

This is from my new sensor:

I have no idea why my blood sugar is out of control overnight. I was thinking that it was laying on the sensor, but I put this sensor on a different arm. I’m thinking this might be due to the drug I’m on, Jardiance, which causes you to pee out blood sugar. I’m wondering if I wrote down when I went pee if that would align with the low values?

But I get a lot of these “spikes” that are assigned values, but aren’t caused by food. That spike of 11 happened overnight, and many of them happen in the morning after I get up and exercise (with no food). Edit: Actually, the spike of 11 is caused by my getting up at about 5:30 am, then the next hump is caused by body weight training, showering, taking the dog for a walk.

This is close to two weeks using the other sensor:

The lows from about 500-1800 are from a 4.5 day fast. The super high at about 2200 is from a vacation where I had a drink and some chocolate.

I need to find an easy way to convert this to days and times, then expand some parts.

The benefit to a CGM is that it would be near impossible to find any of this using pinprick meters. And I specifically got this because I wanted to see what was happening at night. I’ve been thinking for a while now that moving my dinner earlier would be better, because everyone says that. I was expecting to see higher blood sugar, regardless of what I eat, at night based on what everyone says. I was not expecting these highs, and also the lows.


(Bob M) #23

I think the drug I’m on now, Jardiance, has totally messed up my blood sugar:

That 4pm “spike” that was graded a 7 was nothing: I took a quick nap on the couch, where I slept on my back so I don’t think I was on the sensor. No idea why my blood sugar went down then up.

Ate dinner with a few carbs (had shrimp, so made a cocktail sauce with zero-sugar ketchup, hot sauce, horseradish; has some carbs), then had some 70% chocolate to get rid of it. Ate well before 8pm, though did eat some nuts near 8pm…but my blood sugar went up then down? Then all of those peaks overnight are far away (hours) from when I ate.

Doesn’t make sense. I’ll see what happens this week at night, when I have a “normal” week.


(Bob M) #24

The small hump at about 11 am is from my lunch (shrimp with homemade cocktail sauce), ham, cheese, mustard. from 98 to 111. The next hump that’s assigned the value of 10 is my going outside and pushing my snowblower around. Quite challenging, because the snow is about as high as the entrance to my snowblower, and I’m pushing through grass sometimes and up an incline for my driveway. From 90 to 115, not food related.


(Bob M) #25

So, the Lingo’s software tells me that, yesterday, my “Lingo count” was 38, but my target was 20. The 38 comes from “events” that have a height and a duration and that it assigns a value.

The problem?

NONE of these are caused by eating food. NONE of them.

One was caused by higher blood sugar due to waking up then body weight training, and another was caused by higher blood sugar due to my cleaning the 18 inches of snow by pushing my heavy snow blower around. The other one was caused by night-time blood sugar “excursions”, which I have not figured out. Not sure whether this is the drug I’m taking (Jardiance) or sleeping on the sensor.

The two meals I ate weren’t given any value. Very few carbs in them.

I get what they are trying to do, which is limit your blood sugar excursions. But it’s an algorithm based on high carb folks, and us low carb folks don’t fit neatly in that algorithm.


(Bob M) #26

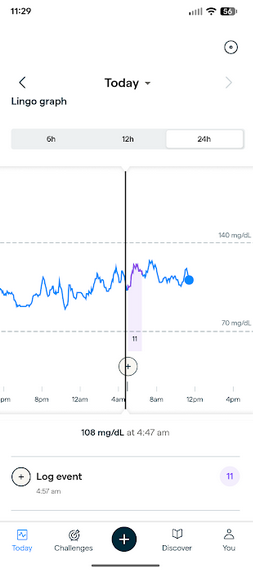
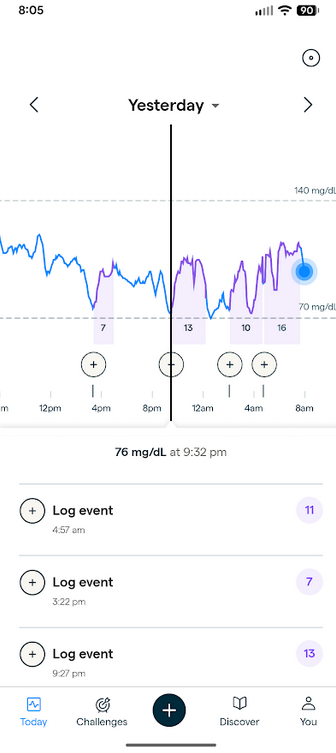
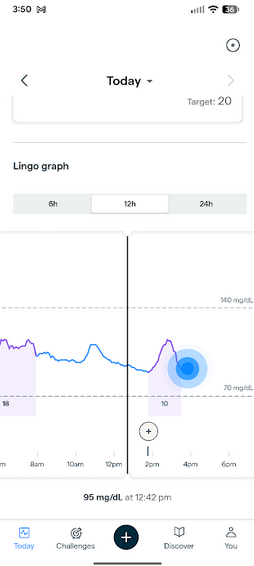
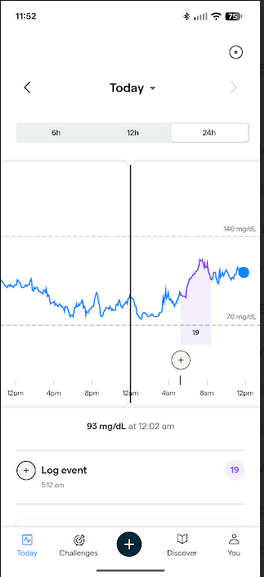
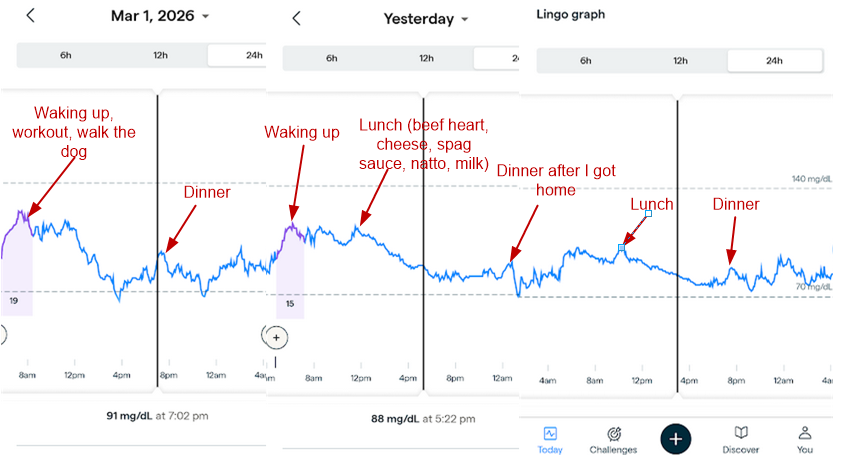
This was yesterday and today. Lingo assigned a “19” to my getting up, going into my home “gym” to do a body weight training of my whole body, then taking my dog for a walk.

The problem is that it has given me a “goal” of 20 for a day. So, I’m 1 below the goal…and I haven’t eaten. As far as I can tell, I cannot turn this off.

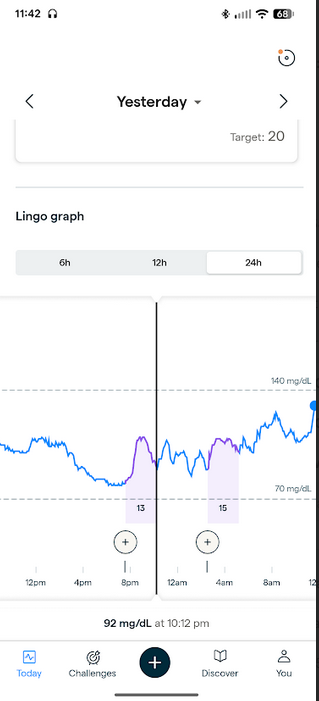
The blip around 8pm is because my wife bought a few “Italian” desserts from a local bakery. I had two, and they were small but sugary. My blood sugar went from about 80 to about 91, duration about 1:30, depending on what the start and end is. (We had my wife’s niece and nephew over with their two babies, so had a keto meal, other than the dessert. Steak tips, brussel sprouts, whole baked cauliflower, those dried butter “biscuits” you can find on here.)

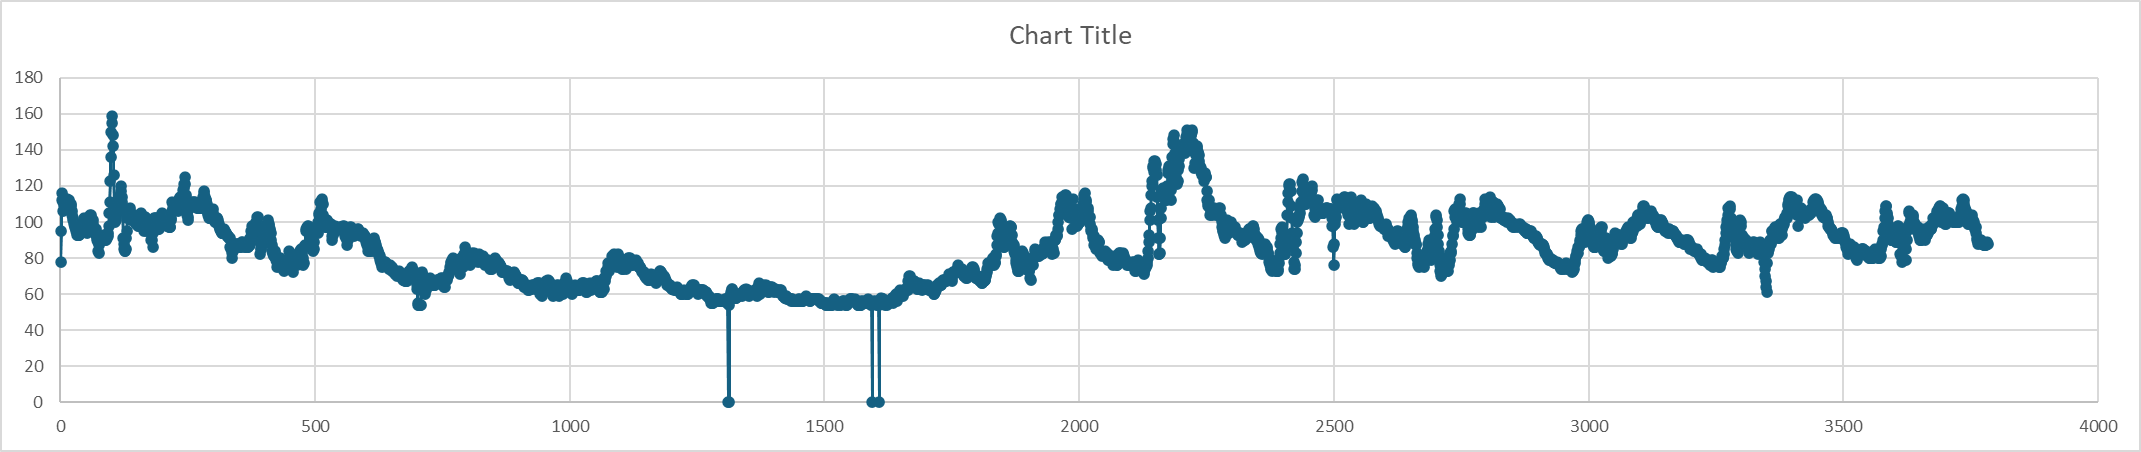
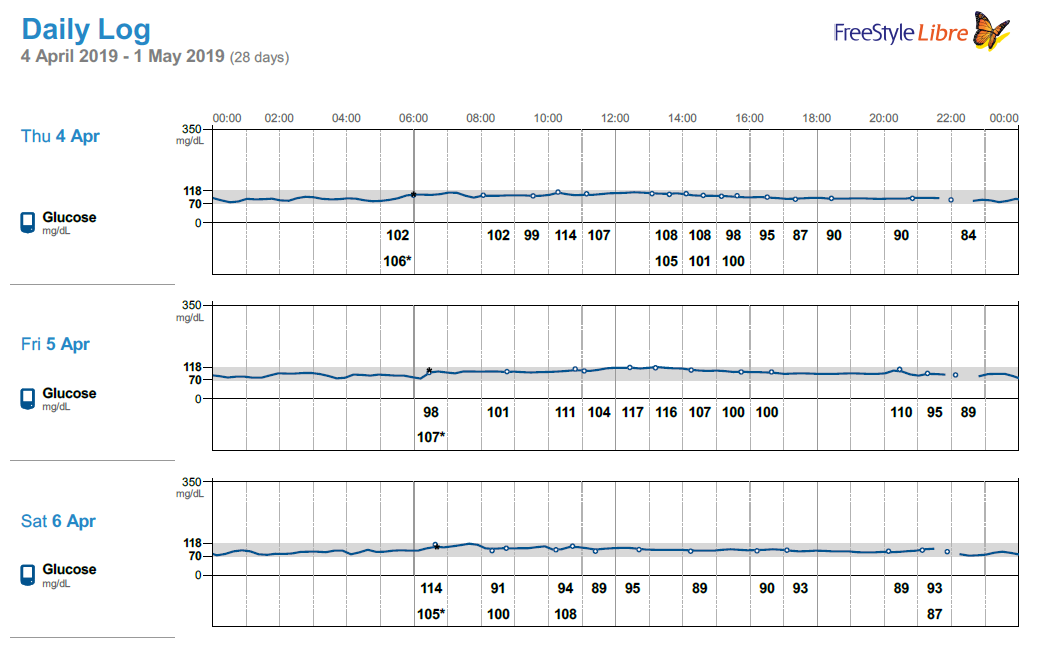
But compare these graphs versus what I got in 2019 when I was using a FreeStyle LIbre:

Look at how smooth those were. There are major differences between the systems, though. Back in 2019, I had a reader and read the sensor at locations where the dots are shown. There about 8 hours of data stored. This means you’d miss some data at times. The Libre also took data every 15 minutes I believe, and it “smoothed” things out, because the internal data was supposedly noisier.

The Lingo stores data every 5 minutes and supposedly takes data every minute and averages that to get the 5 minute data. But whoa, that makes for a noisy signal.

I’m older, I"m on a different drugs (now on Jardiance), but I’m not sure what’s up, particularly at night.

Both systems could provide a larger version of a narrower range. The Libre’s range is 350 md/dL, which is why my blood sugar gets “squished”. Similarly, the Lingo concentrates on the 70-140 range. I think it shows up to 230 (or around there). The highest blood sugar I’ve had in the last few days is 122, and that was this morning during my workout. The lowest was 68. Maybe they could allow you to make the shown part larger?


(Central Florida Bob ) #27

This is one of those things that I just don’t know how to deal with. The datasets look different, and FreeStyle Libre looks more like I think it should look but that leads to asking if either one of them is “Right” or if there is even any such a thing as Right. (Capitalized for emphasis). I’d like to see the data algorithms allow us to try some modifications to how it’s processed and displayed.

Your mention of the algorithms being based on “normies” on the SAD (Standard American Diet) is part of the question. I think the short answer is nobody knows how this should be done so either set of results is as good as anybody’s.


(Mike W.) #28

I think what you are seeing is how much things outside of just eating can affect our BG. Exercise, stress, etc can play a huge roll but most people don’t realize it. The CGM doesn’t lie though. My friends wife wore one and her BG was significantly lower on days she didn’t work. It’s interesting.


(Bob M) #29

In 2017, I bought a year’s worth of sensors. I did learn that exercise causes a blood sugar rise for me (some people get lowered BS with jogging, but I get raised BS and higher for body weight training). And my highest daily readings were exercising in the morning then spending the day doing work around the house (we have a 2 story house with basement, so that’s a lot of walking.)

I also found that the days I didn’t exercise were about 5 points (daily) lower.

I bought that CGM to see what my blood sugar looked like and to test things like whether protein caused a BS rise (none that I could see). I learned things like real pizza causes the worst BS for me; popcorn causes zero blood sugar rise; soup from an Asian restaurant causes really high BS; my BS typically rises and falls in about 1 hour. I got the CGM from Sweden.

But this is from a woman who calls herself Glucose Goddess and does tons of comparisons:

See how smooth her curves are? (By the way, she might have a glucagon problem, because the dip after oat milk shouldn’t be there – glucagon should’ve prevented that.)

Compare with this:

(Edit: missed a “lunch” – don’t eat breakfast – after walking the dog, around 10 am.) So choppy. My BS seems to take longer to return to the “before” value, about 90 minutes. There’s quite a delay between when I eat and when the meter starts registering, more like 45 minutes instead of the 10-15 I was expecting. Some of those peaks are 10 points higher and only last 10 minutes. Is that real? And I find what’s happening overnight to be wild. (I think the Jardiance has something or a lot to do with this, but there’s no way to prove that.)

The comments about the number the Lingo assigns is because I think the idea is that it is supposed to help you lower the peaks/“events” that you have. So, if you’re eating oatmeal for breakfast and that causes an event (as it would for me), then if you eat eggs instead, you’ll lower the value the Lingo’s software calculates.

I think that’s reasonable, as you can do something to improve the score it gives you.

But the peaks I show for these two days, there’s nothing I can do to improve those. I don’t want to stop exercising, since I’ve been exercising multiple days per week for 50+ years. And I can’t really stop the morning BS rise.


(Edith) #30

I’m not sure if this article helps, but it does mention that for people who have the dawn phenomenon and exercise fasted in the mornings, they can see a large increase in blood sugar from exercising.


(Jamey) #31

I’ve been using the Lingo as well. I don’t log anything in the app, I just use the app for the data. I have been using chatgpt to help me understand the data. I upload screenshots of my cgm graphs along with some context about what was happening that day, like sleep, meals, stress, activity, or other symptoms. Instead of reacting to single numbers, it helps me understand patterns and the shape of the curves and spikes over time.

What made the biggest difference was not reacting to individual spikes and instead looking at several days at once. It helped me understand things like stress-driven glucose rises, what stable overnight glucose looks like, and how sleep, ketosis, and stress show up on the graph and it helped me put everything together.

I’ve been using it to help me work through some long covid glucose issues and it’s helped me connect things like sleep quality, autonomic symptoms, and glucose stability. Seeing how all those things using cgm and sleep data has made it much easier to figure out what actually helps and what doesn’t.


(Bob M) #32

@VirginiaEdie That is a good article, thanks for that. I was never really concerned with the BS rise (either for a workout or for the morning rise), as I figure the body knows what it’s doing. And my body is likely “primed” to produce higher blood sugar in the morning, given the many times I’ve exercised in the morning.

(What I AM concerned about is what Jardiance is doing, because you pee out glucose; my BS isn’t that high, so where’s that glucose coming from? I don’t know how Jardiance works, though, and can’t find anyone with a CGM taking it. I’m assuming it’s causing some of these weird dips, and I went so far as to start seeing when I went to the bathroom to see if that aligns with a dip. There does seem to be some correlation, but I’ve only done this a few times. Need to try that again.)

@jamey That is a great idea. I never thought about using Chat GPT for that purpose. I’ll do that when I can.

Also, I think covid is much worse than a minor “cold”. In fact, I got a higher score on my last CAC, and I’m pretty convinced covid was behind that.


(Jamey) #33

I have been dealing with long covid for about 4 years. My first clue was that I gained about 10 lbs within a month of each infection. I started getting methodical with it, first using chatgpt to help me sift through articles, and then breaking down symptoms step by step. I’m finally starting to lose weight again and feeling about 90%. I couldn’t have done this without chatgpt, doctors have been useless.


(Bob M) #34

My last data:

(If I get time, I have the data also as comma separated values, but I have to analyze that with help from my wife, who apparently is good with CSV files. It might take a while.)

That 13 as actually real, as I had some store-bought chili with beans, some “octopus salad” (which had sugar added), and a sugary chocolate drink. Not sure what the 15 was overnight. The peak around 8am was from body weight training then walking the dog.

I think the Lingo is useful. Here are my comments:

  1. It’s helped me realize that Jardiance’s lowering blood sugar might be sporadic and occur at night.
  2. The values for events assigned by Lingo’s software aren’t great for low carb/keto folks. More useful for high(er) carb folks. For a normal low carb meal, even with some milk (to take proteins) and onions and salsa or spaghetti sauce, my blood sugar doesn’t go up much, 10-15 points, and comes back down quickly. But the numbers it assigns are often based on events unrelated to food.
  3. My high morning and low evening blood sugar pattern, which I also saw in 2017 with my other CGM, is still there. Edit: Looked a day when I exercised in the morning. A high of 117 in the morning (7:17 AM) and a low of about 79 from about 6:17pm to 7:30pm, a drop of 38 points. And this occurred every day, though I’d have lower BS in the morning sometimes if I did not exercise.
  4. Real-time readings with readings every minute then storage of a 5 minute average is odd. I’d get up and look at the readings, but by the time I got my own keto meter and blood sugar meter, the values changed. Today, I thought my pinprick meter and the Lingo were about 10 points different, but they were pretty close by the time I took blood. But it’s weird to watch blood sugar go up in real-time (though delayed a bit) and all you’ve done is get up. The same with looking at this after you’ve eaten – you can watch it go up.
  5. The 5 minute readings lead to a very spiky view. There were times when there was a spike of 10 points that lasted 10 minutes. I don’t think that’s actually there, but I have no way to know.
  6. That curve I have where my blood sugar goes from over 100 (usually over 110) to 70-80 by night makes things harder to analyze. For a long time, I thought coffee and tea made my blood sugar go up, but I delayed drinking them, and got the same curves. But let’s say you want to test whether allulose lowers blood sugar. When do you take that? If you take it at lunch (say, 10-11 am), my blood sugar is going down anyway, so what are you looking for? I’ve tested allulose multiple times, and sometimes I think it did lower blood sugar, and other times (like at lunch) ,I couldn’t tell. I’d need much better tracking with when I ate it and what else I ate.

The Lingo is a good tool if you want to test what’s happening and can figure out how to do so.