Homa-ir


#1

Has anyone checked their HOMA-IR? I just got some labs. It is the first time I have ever had an insulin test so I have no baseline. I have been keto for almost two years. FBG was 102. Fasting insulin was 10.0. When I plug into the online calcluators it gives a HOMA-IR of 2.5 and says that I am insulin resistant.

I have upped the protein of late as I am focused on building some muscle. I was hoping for a lower insulin number but I guess this test is notoriously volatile.


(Bob M) #2

Here are mine:

The yellow is after 4.5 days fasting. Not sure what caused that outlier of 93/3.8, nor what caused the 101/33. No idea. Started keto/LC on 1/1/14.

Edit: And compare HbA1c with these. My HOMA-IR went from 0.86 to 1.95, while my HbA1c went from 5.6 to 4.9. Ah, what?

And my fasting insulin when from 3.8 to 33 while my HbA1c went from 5.6 to 5.2. Ah, what?

We need an insulin meter, even a pin-prick one. I suspect that what I’m eating or doing days (weeks?) before will affect fasting insulin, but don’t know. For that insulin of 33, I believe I had fasted multiple days the week of the test or the week before. I’m wondering if the pancreas gets freaked out and overproduces for a while?

Without an insulin meter, we’ll never know.


(You've tried everything else; why not try bacon?) #3

What are your other markers like? I’m thinking of triglycerides/HDL, inflammatory markers (white blood cell count, c-reactive protein, TNF-α, ferritin), HbA1C, and the like.

As far as I know, the only really accurate measure of insulin resistance is an oral glucose tolerance test, which is time-consuming and labour-intensive, and therefore expensive. The pattern of insulin response compared to glucose levels gives an idea of how insulin-sensitive or -resistant one is.
Another measure would be to use a hyperinsulinaemic-euglycaemic glucose clamp, apparently, but I have no idea how that works. (Perhaps by measuring how much insulin is required to get a specific glucose level?)


(Jane) #4

I had my fasting insulin, glucose and a1c checked at around 6 months on keto:

insulin: 4.6
glucose: 83
a1c: 5.2
HOMA-IR: 0.9


(Bob M) #5

Was that a morning value?

If so, my blood sugar is way higher in the morning, by 10-15 points, but my A1c is the same or lower. Why?

Edit: Actually, my blood sugar is higher by 15+ points in the morning, normally.


(Joey) #6

@fitbod Am a bit out of my element here, but my understanding is that a snapshot of insulin levels at any particular instant is about as meaningful as a snapshot of glucose at any particular moment.

This is because a moment in time can’t tell you much about your insulin resistance (except perhaps at some extreme level).

Have you considered an NMR Lipid Panel?

An NMR provides a profile of lipid partials that reveal a good bit about metabolic health (HDL, Trigs, as @PaulL notes above). And an NMR includes a “LP-IR Score” that’s been put forward as measure of insulin resistance vs. sensitivity based on proportions of cholesterol components along a spectrum (i.e., particle count and relative size of VLDL, LDL, HDL). Also Pattern A vs B, etc.

NMR Lipid panels cost around $100 in the US (in case your doc doesn’t want to bother your insurance to spring for it).


(Jane) #7

Yes, I had an early appointment at LabCorp before I went into the office while working in Fort Worth.

eta: just got my bloodwork for my annual physical and my glucose was 89 taken at 8:30 am


(Bob M) #8

Though I got one (and only one) of those scores taken, and my result was high:

image

Insulin was 9.6 uIU/mL and c-peptide was 2.5 ng/mL. I had a zero score on CAC and a very close to normal 2-hour Kraft test (insulin was slightly high after 2 hours, but I also did not carb up).


(Joey) #9

Interesting combination of results. How did this same NMR test report your “Pattern A vs B” position along the spectrum? Also curious as to whether your HDL and trigs are in a better place since going low-carb?


(Bob M) #10

On this particular test, my pattern was barely into A:

I’ve been Pattern A for a while now:

Highlighted yellow = fasting 4.5 days, which wrecks your cholesterol profile. That test above was 1/28/2020.

These numbers jump around. Compare 10/31/16 with 11/14/16. I got the test on 10/31/16, didn’t like the results, went on vacation, came back, got completely different results.

I think the 10/31/16 results were messed up because I did a longer-term fast closer to that date. I didn’t realize at the time that it takes 5 or so days to normalize lipid levels.

I don’t get this type of test taken that often, as I pay for it myself. The 6/14/19 and 6/17/19 tests were a test of Dave Feldman’s cholesterol drop protocol (4.5 days fasting, took a test, followed by 3 days high fat, high calorie, took a test). You might ask why I didn’t take a test before the 4.5 days fasting. The reason: the blood tests for the two tests I did take cost me over $1,000. Couldn’t afford another set of tests.


(Bob M) #11

CAC scan results taken 6/22/19:


(Joey) #12

@ctviggen Fascinating. You’ve got a nuanced combination of biomarkers, which seem to be well controlled … and zero calcification on CT scan to show for it.

On balance, what you’re doing in the context of your genetic predispositions seems to be working. :+1:


(Bob M) #13

That’s what I think too, and I have to wonder how much genetics matters. I mean I ate SAD for a while. Did I repair the damage? Or was I able to delay the damage? That is, did my genetics protect me somehow? Or was I not protected and repaired things? It’s not clear to me, especially since I either didn’t know about these tests or they weren’t available when I first started. I’d love to have taken a 2 hour Kraft test just after starting low carb – note the 37 HDL, and I know I had low HDL for every test I took before starting keto.

One thing that might have helped was that I exercised a lot. I started exercising when I was in my early teens and have never stopped. I spent a few years riding my racing bike 60+ miles per week in the summer (while gaining weight, I might add). And lifting. And mountain biking. Did these help? Maybe. (Didn’t help to control my weight, though, as I gained 90+ pounds WHILE exercising. And lost well over half that, again while exercising.)

I looked into the LPIR, and it was created by testing young, healthy people. There’s a formula for it. They also compare it versus people who they know have “insulin resistance”, though I forget which marker they use (HOMA-IR?).

But I wonder if it somehow fails with low carb folk? I don’t know.


(You've tried everything else; why not try bacon?) #14

Or perhaps it’s a calculation that, like GKI, has relevance in some situations but isn’t always useful in others.

I hate to be always urging caution, but people get awfully worked up about various numbers and forget that we are only just at the very beginning of figuring out how the human body works.

I sometimes wonder what our health situation would look like, if Ancel Keys had reported the correlation between sugar consumption and coronary heart disease, instead of dismissing it in favour of his obsession with saturated fat.


(Joey) #15

@ctviggen Yes, yes, and yes.

Wish I had more pre-keto data too.

Having exercised (cardio) daily for almost 30 yrs while eating LFHC (slowing gaining 25lbs and +4" waistline), I thought it was all just getting old. Didn’t realize damage was happening - until going keto.

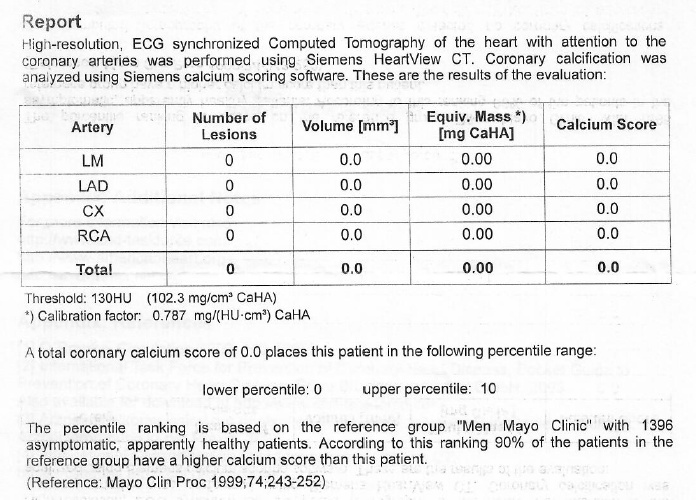
Upon restricting carbs, I started getting CT scans and my CAC scores were increasing steadily with each successive scan. Kind of scary.

I chalked it up to (= hoped?) calcification - reflecting a healthy, if not disconcerting, repair of prior soft plaque damage from all those decades of unrecognized inflammation.

Magically, my most recent CAC score (after 2+ yrs on keto) dropped sharply - although “magically” may involve significant K2/D3 supplementation. Sadly, have no pre-keto CAC scan results - a missed data opportunity.

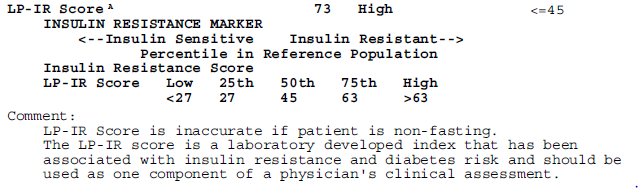
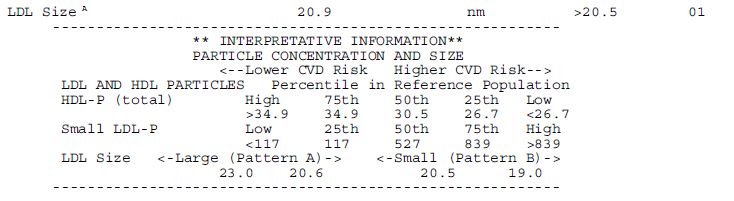
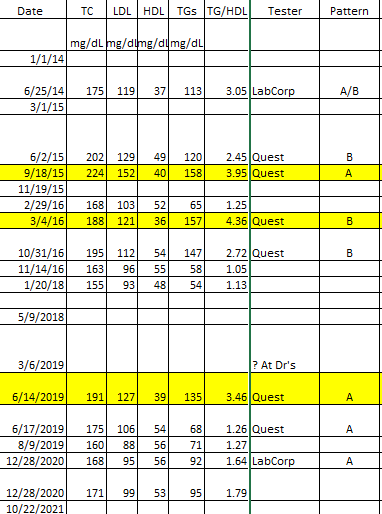
On the lipid side: latest HDL is 119 and trigs are 52. Deep in Pattern A territory, and LP-IR is <25 (below the chart’s bottom end, suggesting significant insulin sensitivity).

Regular exercise (HIIT strength + burst cardio), super low inflammation markers, and elimination of a range of pre-keto inflammation symptoms, all of which suggest keto is “working.”

BTW, eating ample salt and clocking in with low blood pressure, I also lost that 25lbs and came back to a 31" waistline, all while eating to full satiety on LCHF. Not a goal, just things that happened.

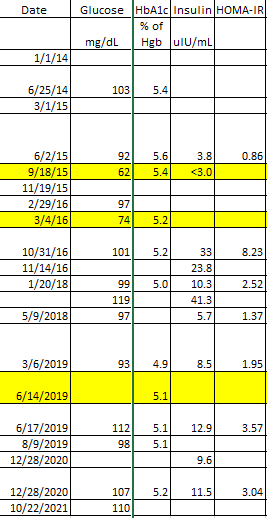
So back to insulin… It’s hard to get agitated about my typical morning glucose level now of roughly 100 mg/dL (had been more like 85 when I started on keto). These days, it meanders higher by as much as +20mg/dL post-prandial, then wanders back down to mid-90s. Safe to assume that’s what my liver and pancreas have conspired to produce.

But since I’ve never bothered having my insulin level tested, I can’t construct a HOMA-IR metric. To @PaulL’s point, context can be a rather important consideration when interpreting biomarker results.

So I’m going to continue assuming this all equates to a rather “insulin sensitive” profile - given everything else going on in this context. :thinking:


#16

I’m actually thinking I am seeing a Cortisol effect. The lab also checked fasting Cortisol during this test. It came in at 19.1 ug/dL which is the high end of Labcorp’s 6.2 - 19.4 range.

I have checked my BG from time to time in the evening and I see lower numbers. I’m thinking it is mainly a Dawn Effect thing with me.

As far as insulin it would be great to be able to check it more often. Binkman has said that blood Ketones are useful to measure insofar as they are our best “cheap” proxy for insulin but having “some” ketones is enough to suggest are insulin is low and higher ketones aren’t necessarily better.


(You've tried everything else; why not try bacon?) #17

Dr. Phinney said, in answer to a question at Ketofest a couple of years ago, that he and Prof. Volek picked 0.5 mmol/L as their threshold, because that was the point at which they began to see the benefits of ketosis. Dr. Phinney added that, while 1.0 mmol/L might be even better than 0.5, levels above that conferred no added benefit.