Got the Stelo


(Bob M) #1

Which is one of the new continuous glucose monitors that are approved over the counter in the US.

Current thoughts:

  • you can buy up to 3 months without having to go on a plan (where they send a new set every month), $100/month, 2 sensors
  • they want you to put a patch on over your sensor, and I had to have my wife put the patch on
  • you need an app on your phone
  • the sensor talks ONLY to your phone; it stores no (or very little) data. What this means is you need your phone near you at all times, even when sleeping; you can’t leave your phone downstairs, while sleeping upstairs, which is what I used to do
  • it seems like blood sugar is highly variable on the sensor as compared to when I used a different sensor system (Free Style Libre)
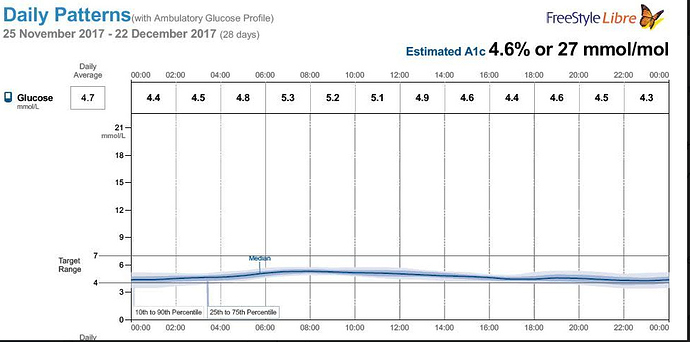
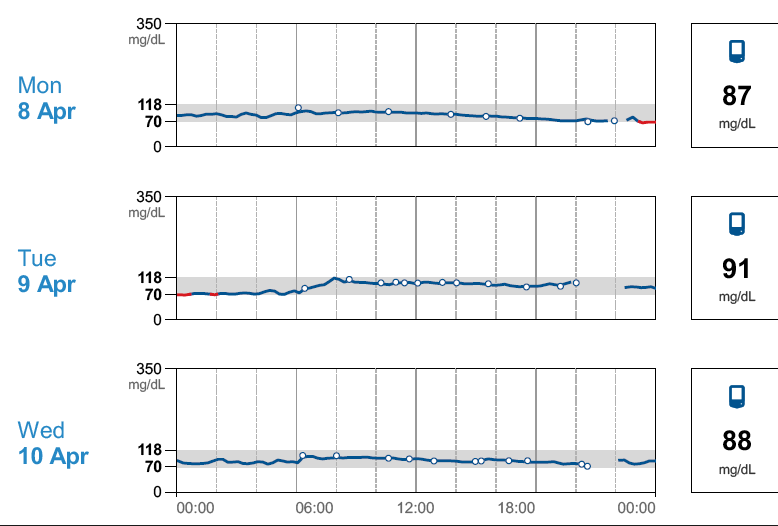
  • I don’t see many ways to analyze data. For instance, on the Free Style Libre, I could download data (up to 8 hours) to a sensor, then take that data and put it into a computer or software. Like this:

Or this:

I’m still getting used to it, though, and will report back later.


(Bob M) #2

I’ve been comparing the results of a Keto Mojo blood sugar monitor with the Stelo. The KM seems to be about 10 points lower. Of course, I don’t trust it either. :wink:

I had lunch with some raw milk and 3 small tomatoes. My blood sugar went up. Unfortunately, there doesn’t seem to be a way for my to determine what the high was. I see a small rise, less than an hour long (which is normal for me if I eat higher carb), but I can’t select anything to see what the results at a particular time were.

That was the problem with the data for the Free Style Libre, too. You could see your blood sugar went up, but there was no way to determine the high level.


(Bob M) #3

Well, the software is garbage. All it tells you is the current blood sugar reading. It shows you a graph, but you can’t select anything. So when I had tomato + raw milk and got a slight increase, I can’t click anywhere to see how high it went. I wanted to show a graph, but my Android phone won’t take a screenshot. It takes the screenshot, but it’s totally blank.

I was going to say that it seems about 10 points high compared to my Keto Mojo, but then I tested once where the Keto Mojo read 10 points higher instead of 10 points lower. The joys of a meter.

I want to be able to compare a day of exercise with a day without. (My blood sugar went up about 15 points during my morning exercise.) I want to see if allulose really does decrease blood sugar, but I again need to compare days (one day with allulose, one without).

The software does not allow me to do this. It’s disappointing.


(Bob M) #4

This is one version of a screenshot. They’ve somehow prevented Android from taking a screenshot. So, I can’t even keep a daily screen shot of what happened, and I can’t show you what the interface looks like. I can stake screenshots of other apps, but cannot take a screenshot of this one. And the only real data analysis they have compares how long you’ve been in your “target range”, which is basically useless for me.


(Bob M) #5

This is slightly better than I thought. If you move your phone into landscape mode, it provides you with a graph that you can actually interact with. My blood sugar was 110 before I went on my jog with my pup, and hit 134 during the jog. So, an almost 25 point rise.

I took a pin-prick meter comparison not too long ago and got about the same as what the Stelo said. This is why I can’t stand pin-prick meters: I’m getting everything from about 10 points below the pin-prick meter, to 10 points above the pin-prick meter, to exactly what the pin-prick meter says.

You can add “events” like “eating lunch”. They just appear as a small dot on the landscape graph. If you want something that tells you your current blood sugar and shows you what happened in the past, where you can go back through your plot for 24 hours (no longer than that), it’s OK.

I want way more. I want the ability to see what happened on individual days. What happens on the days I don’t exercise as compared to when I do? What happens if I eat X on Day 1, then eat Y on Day 2? This doesn’t provide any of that information.


(Bob M) #6

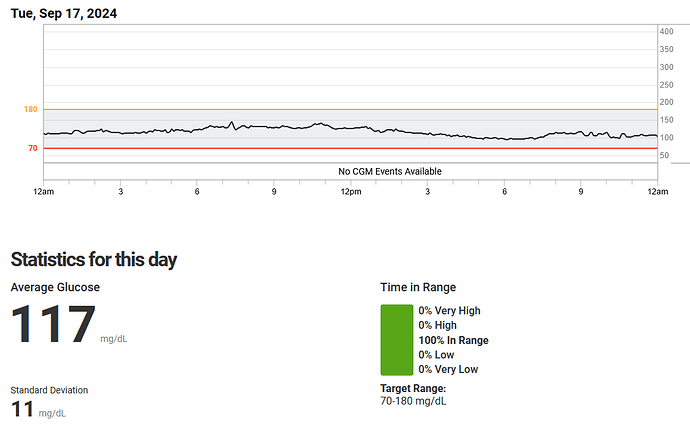
Well, I’m totally wrong. You can get the data, but you have to log into the “Dexcom Clarity” website. This is yesterday’s data:

117 mg/dl average…Yikes! 20 points higher than what it used to be.


(Bob M) #7

Well, I left my phone downstairs by accident overnight, and the data is all there:

image

I do know there’s some data storage on the sensor, as I’ve walked away from my phone at work and I got an “error” saying “no data - wait up to 30 minutes”, and the data showed up on the phone app.

That bump at around 7:30 am is a 2.2 mile jog with my pup. I go from about 106 to 132 when jogging.

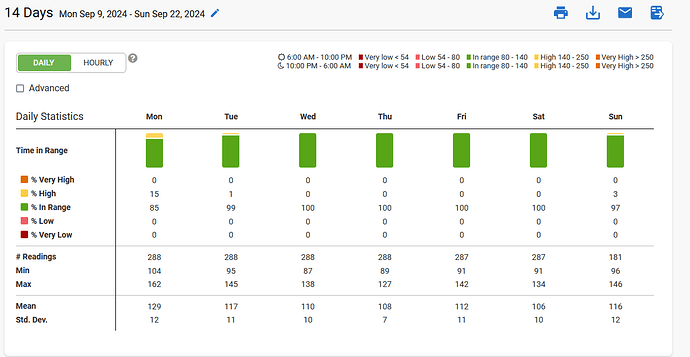
The data analysis on the Clarity website is interesting:

While my average blood sugar is disconcerting to me, the standard deviation is only around 10, which means that most of my blood sugar readings are within a very narrow range (average plus/minus the standard deviation). Standard deviation is a way of describing how spread out data is: smaller standard deviation means data is less spread out; larger standard deviation means data is more spread out. The vast majority of my blood glucose readings are within a narrow range.

Edit: I’d ignore the first day (Monday), as that was when I put the meter on. The second day (Tuesday) might be suspect too, as sometimes these sensors take a while to “settle in”. Thursday, I ate OMAD with no exercise, which is why the standard deviation is so low (exercise = much higher blood sugar for me). Today (Sunday) is high because I went jogging. It’ll go down all day and will end lower.

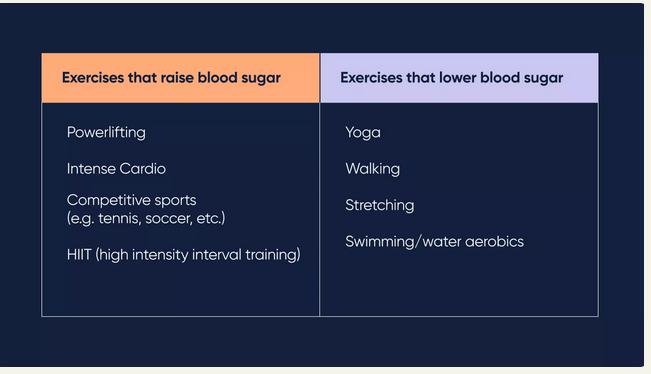
I’m on the Stelo mailing list, and they sent me an email this morning telling me how exercise affects blood sugar. It actually seems reasonable:

image


(Central Florida Bob ) #8

So many questions…

Being an inveterate experimenter (as you are) I’m interested but I did some searching and was more confused than before I started.

A check on both Amazon and Walgreens returns a bunch of what just appear to be the patches. They talk to the app on your phone? I’m going to SWAG Bluetooth because the LE (Low Energy) version is super easy on batteries. Is the app the only thing you interface with? I mean you stick the patch to your arm and then it connects to an app by itself, or what?

Maybe there’s a tutorial video out there.

The chart on exercises that raise or lower sugar also leaves a cloud of question marks over my head. My bike rides alternate riding comfortably with pushing to get a higher speed. Is that HIIT? Intense cardio? Besides slinging heavy weights around until exhaustion, what is HIIT?

No criticism intended. I’ve never tried one of these things and have more questions than answers.


(Bob M) #9

Hi Bob,

They are the sensors only, then you have to download the app. You have to have a phone. It does appear to be low power bluetooth, and the app and bluetooth are connected all the time. You have to have the phone within 20 feet of the sensor, so I have to take my phone to bed with me, though I did leave the phone downstairs one night and still got all the data, even with some signal loss.

In my opinion, it’s pretty worthless unless you go here:

https://clarity.dexcom.com/

You set up an account so that the data from your app gets uploaded to the Clarity website. If you don’t go to the website, the app’s functionality is very limited. Almost useless.

As for the exercises, I think you’d have to test them yourself. Exercise for me causes me higher blood sugar, but that’s body weight training to failure or jogging. Don’t know about the other exercises, but there is data out there indicating walking after eating reduces blood glucose and insulin. I usually don’t walk after eating, so I haven’t tested that.

And that chart is made with high carb folks in mind. It’s probably going to be different for people who don’t eat many carbs.

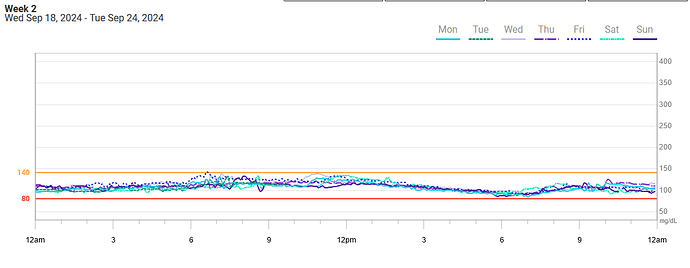
Since it is used for people with higher blood sugar swings, that’s what it appears to be set for. For instance, I can’t make this zoom in on the 80-140 range (this is today’s):

This morning I did a body weight workout, started right above 100 and ended at 121, about a 20 point rise. That weird little hump is due to showering. Not sure that’s the sensor getting weirded out or actual blood sugar change. One day, I’ll stick my arm outside to see what happens.

Have noticed that jogging creates a higher blood sugar for longer, see the bump between about 7:30 and 8:30:

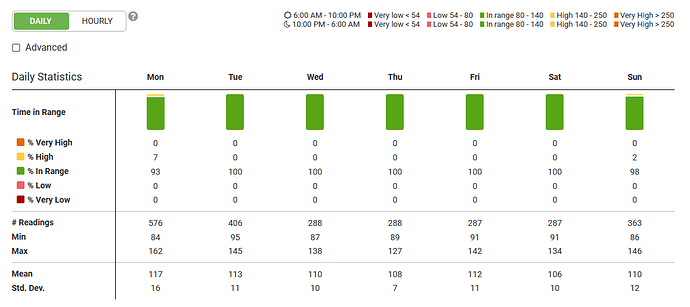
Some patterns do emerge:

Thursday, I did not exercise and fasted to dinner (OMAD). Saturday, I did not exercise but ate 2MAD. Those days have lower blood sugar than the days I exercised (about 1 hour of body weight training on Monday, Tuesday, Friday; jogging Sunday and Wednesday).

You can overlay them, and compare:

I don’t eat until after 10 am, so all that “stuff” before then is due to exercise and showering. After 10 am, that’s lunch/breakfast, which usually has raw milk and might have things like tomatoes. After that, my blood sugar consistently drops until dinner around 6:30-8pm. But I also have some chocolate chips at night, around 8-8:30pm, which is why my blood sugar pops up. Then I go to bed around 9pm.

(Central Florida Bob ) #10

Thanks for explanation and introduction. It’s an interesting little rabbit hole to dive into, and I’ve wanted to dive in for a while. I have a “one stick at a time” glucometer, although I haven’t used that in a long time. There just isn’t a way to live with that sort of meter and get the kind of data you can get with one of these CGMs. I mean, I can do test meals and stick a finger 30 minutes later, but taking them at fixed intervals for a few hours requires pretty much doing nothing else. Stopping to do it during a workout more than an hour long is even less likely.

It makes sense to put as little in the sensor patch as you can get away with putting in it, since I’m assuming it just gets tossed when it’s done. Which, of course, puts a premium on the phone you’re linking to. A quick search on the iTunes App Store shows “Stelo by Dexcom” and a few others. Do you happen to know if multiple apps work with it, or only one?

I’m a little put off by the aspect of having to go register on the “Clarity” website, but add that to the list. I used 23&Me and now they say our data is everywhere across the globe. The Social Security Administration was hacked. The more that gets put online the more it turns into a modern version of that 1800s bank robber. “Why do you rob banks?”… “That’s where the money is” It attracts all those with bad intentions.


(Bob M) #11

I agree, Bob. Even the Keto Mojo makes you sign up if you want to see all your data.

I don’t know if anything else works with Stelo. I have the Stelo app running on an Android device. And, like you, I don’t like all my data up on the cloud. But then again, they’d be getting my blood sugar data, which I’m not sure what anyone would want with that. (Though to buy the device, you need credit card information.)

I seem to remember that there’s login info for the app, but separate login info for Dexcom. Or at least I think that’s how it worked.


(Bob M) #12

Talk about being confused. Fasted 12+ hours (water only, not even coffee), got an official blood sugar test done drawn by Labcorp. Here are the results:

90: Labcorp
97: Keto Mojo
109: Stelo

Ah, what?

The comparisons between the Keto Mojo and the Stelo have been all over the place. Often, they’re close; but sometimes the Keto Mojo is lower; and rarely, the Keto Mojo is higher.

But this is a shocker. 20 points higher for the Stelo? Yikes.

Not sure what to do with this information. The Stelo is still good for trends (what happens when you exercise/eat?), but I can’t trust it (or the Keto Mojo) for actual values.


(Central Florida Bob ) #13

Ah, the joys of measurement uncertainty.

Years ago someone posted a link to a study on the accuracy of blood sugar meters. My file is dated 2017, the study is dated 2016. The most accurate was the Contour Next, with an overall 5.6%. In the therapeutic range of 70-179 mg/dL, it was considerably better at 4.8%.

No two of those measurements are within that range of each other.

The worst of the meters they evaluated was 20.8% overall and 16.7% in the therapeutic range, but some were worse in that (more important) range than the overall. The total difference between Labcorp and the Stelo is 21.1%. I read that as all three measurements could be the same value, and it’s just individual differences between the “meters”. Since I don’t know if Labcorp uses this sort of meter, it might be a completely invalid comparison. It might even be wrong to assume Labcorp is the correct value. The more important question is which one is closest to correct, which you and I can’t know.

Like most measurements in biological systems, it’s messy. Hemoglobin levels affected accuracy so being anemic can mess up the measurement. Newer meters (by FDA approval date) were better than older ones. That kind of stuff.

So I think the most useful thing about the CGM is what you’re using it for: trends. It will take effort to remember that no particular reading may be “right” - it’s the deviations that matter. The value may be incorrect, but from minute to minute or hour to hour, the changes are most likely consistent.


(Bob M) #14

Yeah, Bob, I bought the Contour Next based on that. When I got an official test done with the Contour Next and my (European) FreeStyle Libre CGM, they all read the same.

I don’t know how LabCorp does blood sugar testing, but the woman taking my blood says it all goes somewhere else to get tested. Since I assume any test has error, the LabCorp test would have error, but I’m assuming it’ll be in the small percentages, maybe a percent or a few percent. I don’t know that though.

The problem is that the last two days, I’ve been getting higher morning blood sugar (let’s say 120) for my Stelo CGM, but then my Keto Mojo has been giving me blood sugars 20 points higher. Ah, what? Now, I assume my blood sugar would be higher because I ate very late both nights.

But one of the tests I want to do is eat say at 8:30pm and see what my blood sugar is the next morning, then eat before say 7pm and see what blood sugar is in the morning. I’m theorizing it would be lower eating at 7pm, which is why I made my blood draw be at 8:30 am and made sure I finished eating before 8:30 pm the night before: That’s 12 hours without eating. I’m assuming that 10 hours or 8 hours would cause higher blood sugar (and insulin, but I can’t test that).

It’s hard to do these types of tests when I can’t believe anything I’m seeing.

It’s a bit of a bummer.

I have some other tests I might be able to do. I want to see what happens if I take 2 tsp of allulose for lunch one day and don’t another day. I’ll try to keep exercise and food the same. I want to see if allulose really does lower blood sugar. That might work? We’ll have to see.


(Central Florida Bob ) #15

I figured you must be familiar with that measurement uncertainty stuff, but my particular niche (radio up through millimeter wave frequencies) had more need to live in that domain so I spent a lot of time with it.

Not only are the meters far less accurate than I’m used to but we humans are much less stable than the circuitry. Our glucose varies between measurements all on its own, based on our built in control loops.

The allulose experiment could be interesting. I need to rewatch it, but I think I recall Nick Norwitz’ video on allulose acting like an OTC GLP-1 agonist as saying you needed an absurd amount of it. Not like a gram or two, but like tens of grams. I want to say 90 grams.

That said, I’m playing around with it, like putting it in my morning coffee and trying to see if I feel less hungry or less desire to eat.


(Robin) #16

Bob, we never stop experimenting, do we… even after all this time.


(Central Florida Bob ) #17

It took me a while to find this because I looked in the wrong video, but in the 5-6 minute range in this one:

https://www.youtube.com/watch?v=ZY2vU9I5uic

Nick is saying in the experiments they ran on mice, they used 1 to 3 grams per kilogram to dose the mice. I think that’s per day in one lump. The paper he refers to, BTW, is dated 2018.

Assuming that would be the case, and the assume it’s per kg of entire body mass, not lean body mass, that puts me in the range of at least 93 g to 279 g. Nick warned that much gives him “digestive distress” (or that other “D” word).

In my mind, I can imagine a company that’s selling allulose doing some small study with a group of volunteers, getting similar results, and putting something on the labels equating it to Ozempic or Wegovy. I bet that would get it on the shelf of my local grocery store.


(Bob M) #18

@robintemplin Yeah, I’m an enginerd at heart, so I look at things differently. I’m the person asking, what happens if I do X, and why?

@CFLBob I was testing 2 tsp of allulose plus 1-2 tsp of inulin in some raw milk for lunch. Could run into some digestive issues, but I didn’t test well enough to determine what was the problem, the allulose and/or the inulin.

At first, I got some huge decreases in hunger. It took a while to show up, as in hours after I ate my first meal, but sometimes at dinner, I not only was not hungry, BUT I also ate less. After testing it 3-4 days per week for a while, the effect waned. Now, I’m taking some time off to see if I do it again, what happens.

But I think that hormones, of which GLP-1 is one of many, is why some of us don’t get back to our “teen” weight. (Though back then I was a young buck who was a body builder, so I had way more muscle than I do now.) If there’s a way to help hormones cause less hunger, I’m for it.

This is from The Metabolic Link, which I listen to as a podcast, and is entitled, “How allulose aids metabolism and Fructose fuels cancer”:

https://www.youtube.com/watch?v=FsUlYB-AolY

It has some suggestions about how much allulose to take, and I didn’t think it was that much. But I’ll listen to it again.

There’s definitely an amount of allulose that causes me some digestive issues, but I haven’t tracked down how much. I think 2 tsp is ok, but I’d have to get rid of the inulin. For me, the inulin, which I take sometimes by itself, seems more troubling at the same levels of tsp (not sure about weights, though).

I still can’t figure out what my blood sugar is. The last two mornings, the Keto Mojo was higher than the reading of the Stelo. Which means that the Stelo (or the Keto Mojo) is more useful for trends rather than as an accurate tool.


(Central Florida Bob ) #19

Thanks for that video. The paper on allulose sounded like the same 2018 paper that Nick Norowitz went over in the link I put up.

One of those aspects of feedback loops that can be confusing is the way they adapt to what you’re doing. Unlike our bodies, when troubleshooting control circuits, it’s easy to break the loop, inject a signal into it and see how it behaves. When we consume allulose and get the GLP-1 agonist action, we can’t do that. Does our body respond with some other hormone that might be undiscovered or that we’re not aware of that changes that reaction or even some other reaction? A way to measure our GLP-1 levels directly, instead of blood sugar, which is some number of changes “downstream” of thing we’re doing would be wonderful, but my guess is “that ain’t happening”. At best, blood sugar is an indicator of our internal state, not a direct measurement. Unfortunately, it’s what we’re trying to change.