
And no pre COVID scan either I guess…
Opening Up Results
 Play nice, everybody.
Amanda1
#277
Consistency - are you saying that people with blood group A/B will suffer more from covid? If so then these people should also shield themselves but Kendrick is right in that we need an exit plan. He’s only suggesting the people that we think are healthy should not have to keep so far away from others. It is nonsensical to allow a maximum of 6 people get together outside whilst allowing a restaurant or pub full of people. We can’t just sit and wait for a vaccine. Lots of people I know talk about when this is over. When exactly will that be? We have to move forward.
In the uk hospital admissions are not going up. Cases may be but we’re testing more. We wanted to not overload our hospitals. Well we didn’t, they can now cope. I’m not saying we shouldn’t be careful but we must move on.
ElmosUzi
(Elmo)
#279
Nobody is outright dismissing immunity at this point, are they? Obviously, some of us have higher risk from the virus.
Yes - ‘safe spread’ - Ivor nearly constantly harps about us not being able to prevent the spread (he says, “These curves are baked in, essentially”). So, what would he have us do differently? If he thinks measures are ineffective now, then how would he presume that we would protect the vulnerable, if we deliberately increased virus spread?
I can’t see the graphs. But I did check some of the actual numbers, i.e. yearly deaths in countries, before I said Ivor’s stuff was fake or deliberately deceptive.
I do think Ivor has “given up,” in a sense, and that his statements about “good science” are now cringe-worthy.
I don’t know whether Ivor actually does the work of researching/setting up his presentations, or is he just reading/going over what people have handed him - either physically or via the internet?
About the deaths in countries - 8:23 Ivor is saying, "…why Sweden would have been higher (in mortality) than other countries, particularly the Nordics." He’s acting like relatively few deaths in 2019 set Sweden up for higher mortality in 2020, and he says the same is true for The Netherlands, Great Britain, and Spain. For Finland and Norway, Ivor says “very different looking” graphs. He says, for Finland and Norway, “normal enough death rates in the prior years.”
I suspected Ivor was trying to pull a fast one here, so I checked what was going on in the larger context, i.e. where were 2018 and 2019 compared to existing trends, the average mortality of the past 10 years, etc.
I don’t know where the supposed information - the charts he showed - from mortality.org is coming from. I can see a good bit of information on deaths there, but only through 2018 for Great Britain, and I don’t see anything for deaths in 2019 for any country.
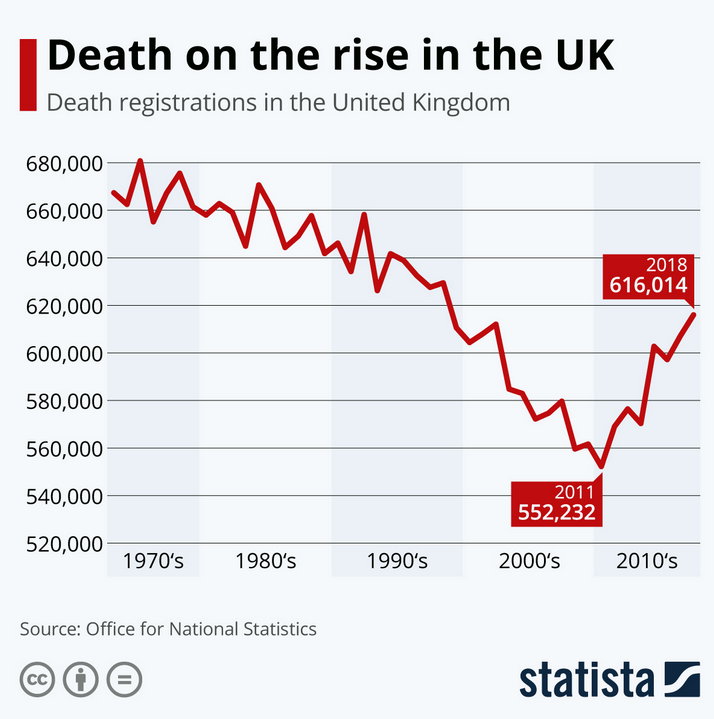
So, Ivor and his cherry-picking. UK deaths had been in an overall uptrend from 2011, and 2018 is a relatively high point, so comparing 2019 with it may not give the best results. To me it looks like one would have to go back to 2000 or 1999 to find a year with a higher death number.
Not having 2019 figures yet, I looked at macrotrends.net, which gives a UK death rate of 9.382/1000 for 2018, and 9.398 for 2019. A small increase, +0.17%. At this point, it looks like Ivor’s claim that the UK had “a huge trough” in mortality for 2019 is BS. And in any case, it’s silly to act like the UK would have been somehow “way behind” on deaths, given what occurred from 2011 onward, and thus extra-liable for a higher death rate from Covid-19 in 2020.
The Netherlands had a heat wave in 2019, and the death rate was 1.1% above that of 2018, and 5.6% above the 10-year average. Ivor says The Netherlands had “fewer than expected deaths,” but this too appears to be false.
“Pretty much the same for Spain” - here we do have a 2.4% decline in mortality from 2018 to 2019, but 2019 is still 3.6% above the 10-year average. It is only Ivor’s cherry-picking that is deceptive.
Sweden did have a decline from 2018 to 2019, 3.8% - the biggest of any country mentioned. It was also 2.1% below the 10-year average.
Finland: 2019 was 1.06% below 2018, while being 3.5% above the 10-year average.
Norway: 2019 was 0.38% below 2018, while being 0.8% below the 10-year average.
“So this is most likely the biggest factor driving Sweden’s numbers, and most countries’ numbers, actually, independent of lockdowns and distancing.” – I think this is ridiculous, and that Ivor is being juvenile and silly trying to obfuscate things this way. To begin with, consider the extreme extent to which some countries have limited their deaths.
The entire range of the countries above, for 2019 versus 2018, is +1.1% (for The Netherlands) to -3.8% (for Sweden). Does this really make sense as the ‘biggest’ factor’ when it comes to Covid-19 deaths?
Ivor’s analysis is necessarily wrong for the UK and The Netherlands, and I think it’s senseless to assume that the small negative changes in mortality in the rest of the countries from 2018 to 2019 makes that much of a difference. This is yet another case of intentional deception and taking things out of context.
Especially when we consider Sweden and Norway. There’s Norway, having less deaths in 2019 than in 2018, as does Sweden - with Sweden admittedly having a greater percentage decline. Both countries for 2019 were below the 10-year average. Ivor tries to make a big thing out of Sweden’s 3.8% decline against Norway’s 0.38% decline.
I would say to him, “Well okay, Ivor, Sweden did have 3.4% greater decline in mortality than Norway, but here we are and Sweden also has 1080% greater per-capita deaths from Covid-19 than Norway. With that in mind, do you really think your thesis explains things and somehow “excuses” Sweden?”
anon81060937
#280
-https://en.wikipedia.org/wiki/Blood_type
-https://onlinelibrary.wiley.com/doi/10.1111/bjh.16932
O+/B+ are the silent spreaders.
I’m not waiting for a vaccine either but blood types truly at risk should be made aware of their vulnerability.
Polly1
(Polly)
#281
I agree that it looks as though we are suddenly having a higher death rate. Looking at your graph the death registrations had been falling since the nineteen seventies. From my family data alone this is understandable. I had three grand parents alive in my life-time and they all died in their seventies (one in the 1960s and two in the 1970s). Their children’s generation (ie my parents’ generation) had extended longevity which was possibly a result of modern medicines. My children had four grandparents who lived to old age. One is still alive at 95, one died at 95, one died at 86 and one died at 84.
On the basis that it has been possible to extend life but not extinguish death altogether there is bound to be a rise in registered deaths when that life expectency increase is worked through and people reach the end of the line.
I realise this is observation of a small sample but it makes sense to me and hope it does to others.
ElmosUzi
(Elmo)
#283
Yes, that decline over a ~40 year span is impressive - those are raw numbers, while the population increased by 14% or 15%.
PaulL
(You've tried everything else; why not try bacon?)
#284
Deaths need to be viewed in the context of death rates per capita, and reasons for population increase or decrease need to be taken into account. For example, if the death rate declines a bit from an influx of healthy young immigrants, that is different from a decline in death rate resulting from better health care. In other words, these things are complex, and it is not always easy to take confounders into account.